Atlantic County, New Jersey Nativity & Citizenship Status (2024)
Place of birth and citizenship status analysis for Atlantic County, New Jersey
Atlantic County, New Jersey Nativity & Citizenship Indicators (2024)
Native Born
84.1%
Foreign Born
15.9%
Naturalized
9.1%
US Citizens
93.2%
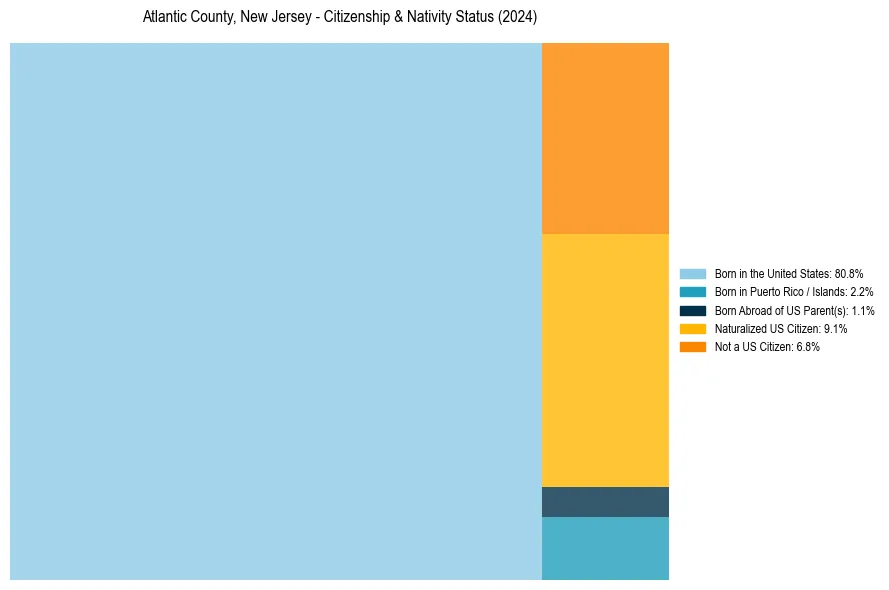
Atlantic County, New Jersey Nativity & Citizenship Distribution
Atlantic County, New Jersey Historical Nativity Trends (2010–2024)
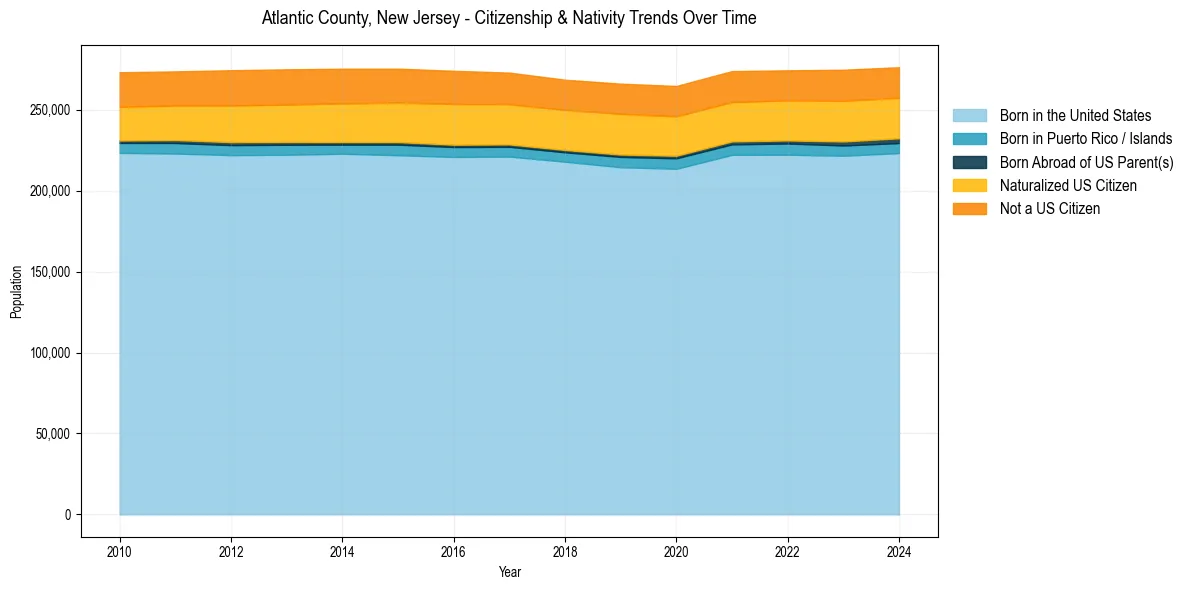
Atlantic County, New Jersey Population & Nativity History
| Year | Total Pop | Foreign Born | Native Born |
|---|---|---|---|
| 2024 | 276,270 | 15.9% | 84.1% |
| 2023 | 274,704 | 16.1% | 83.9% |
| 2022 | 274,339 | 15.8% | 84.2% |
| 2021 | 273,865 | 15.9% | 84.1% |
| 2020 | 264,650 | 16.3% | 83.7% |
| 2019 | 266,105 | 16.5% | 83.5% |
| 2018 | 268,539 | 16.2% | 83.8% |
| 2017 | 272,926 | 16.3% | 83.7% |
| 2016 | 274,026 | 16.7% | 83.3% |
| 2015 | 275,376 | 16.5% | 83.5% |
| 2014 | 275,325 | 16.5% | 83.5% |
| 2013 | 274,960 | 16.3% | 83.7% |
| 2012 | 274,402 | 16.2% | 83.8% |
| 2011 | 273,674 | 15.5% | 84.5% |
| 2010 | 273,162 | 15.4% | 84.6% |
Nativity & Citizenship FAQs for Atlantic County, New Jersey
Approximately 15.9% of residents in Atlantic County, New Jersey were born outside the United States.
The vast majority of residents, roughly 93.2%, are U.S. citizens (including both native-born and naturalized citizens).