Rockingham County, New Hampshire Nativity & Citizenship Status (2024)
Place of birth and citizenship status analysis for Rockingham County, New Hampshire
Rockingham County, New Hampshire Nativity & Citizenship Indicators (2024)
Native Born
94.8%
Foreign Born
5.2%
Naturalized
3.5%
US Citizens
98.2%
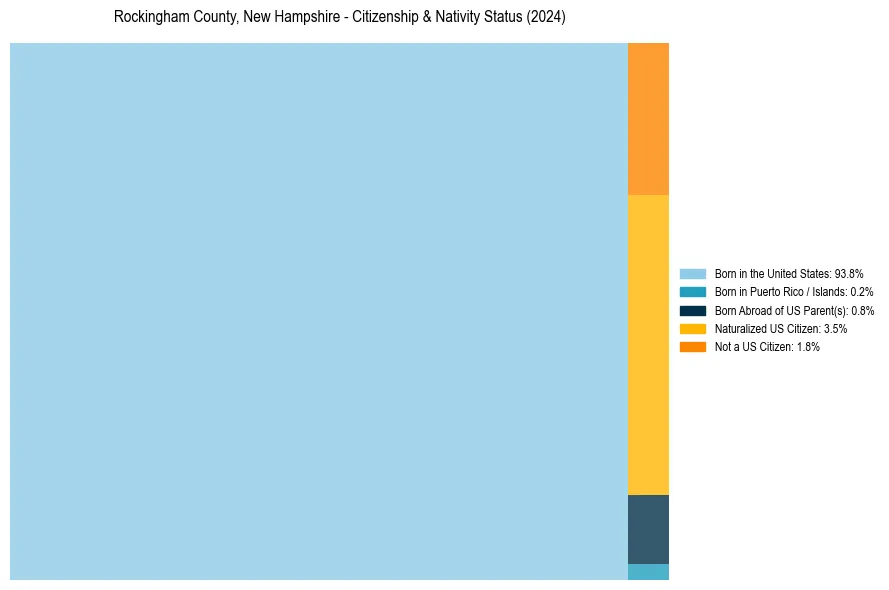
Rockingham County, New Hampshire Nativity & Citizenship Distribution
Rockingham County, New Hampshire Historical Nativity Trends (2010–2024)
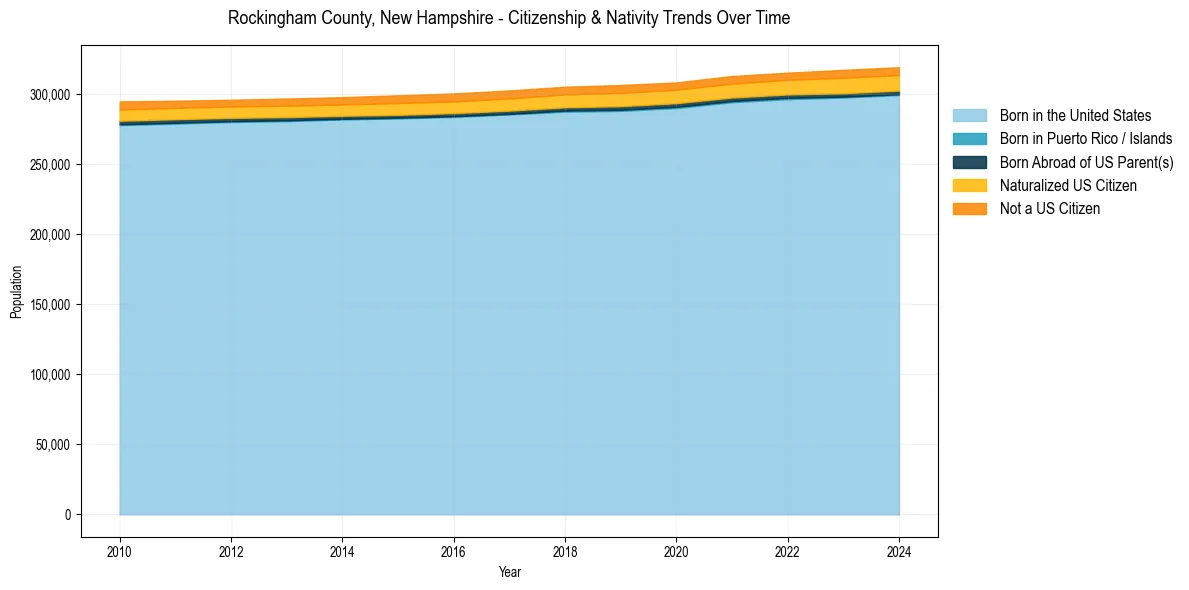
Rockingham County, New Hampshire Population & Nativity History
| Year | Total Pop | Foreign Born | Native Born |
|---|---|---|---|
| 2024 | 319,082 | 5.2% | 94.8% |
| 2023 | 317,163 | 5.3% | 94.7% |
| 2022 | 315,169 | 4.9% | 95.1% |
| 2021 | 312,771 | 4.9% | 95.1% |
| 2020 | 308,211 | 4.8% | 95.2% |
| 2019 | 306,359 | 4.9% | 95.1% |
| 2018 | 305,129 | 4.8% | 95.2% |
| 2017 | 302,479 | 4.8% | 95.2% |
| 2016 | 300,365 | 4.7% | 95.3% |
| 2015 | 299,006 | 4.7% | 95.3% |
| 2014 | 297,702 | 4.5% | 95.5% |
| 2013 | 296,718 | 4.5% | 95.5% |
| 2012 | 295,872 | 4.4% | 95.6% |
| 2011 | 295,162 | 4.5% | 95.5% |
| 2010 | 294,638 | 4.7% | 95.3% |
Nativity & Citizenship FAQs for Rockingham County, New Hampshire
Approximately 5.2% of residents in Rockingham County, New Hampshire were born outside the United States.
The vast majority of residents, roughly 98.2%, are U.S. citizens (including both native-born and naturalized citizens).