New Hampshire Nativity & Citizenship Status (2024)
Place of birth and citizenship status analysis for New Hampshire
New Hampshire Nativity & Citizenship Indicators (2024)
Native Born
93.9%
Foreign Born
6.1%
Naturalized
3.7%
US Citizens
97.6%
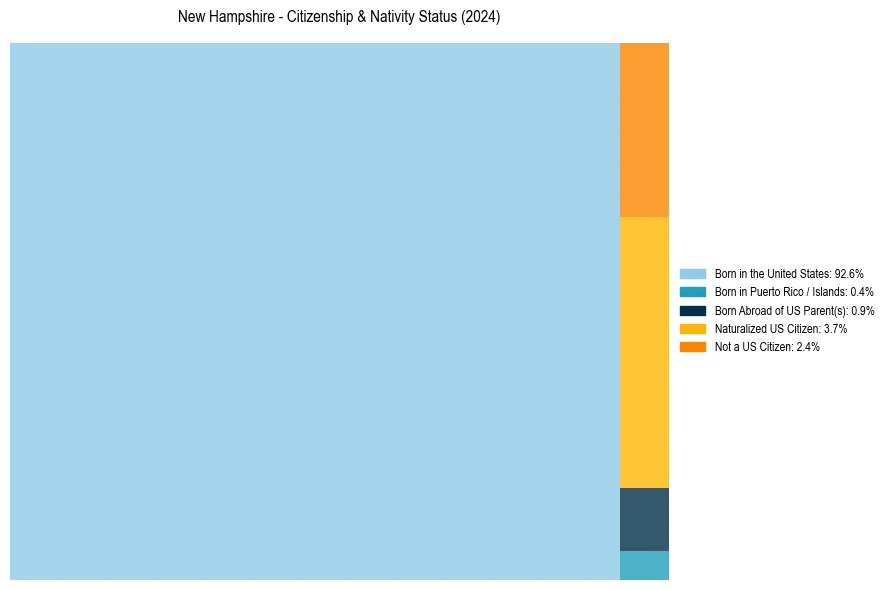
New Hampshire Nativity & Citizenship Distribution
New Hampshire Historical Nativity Trends (2010–2024)
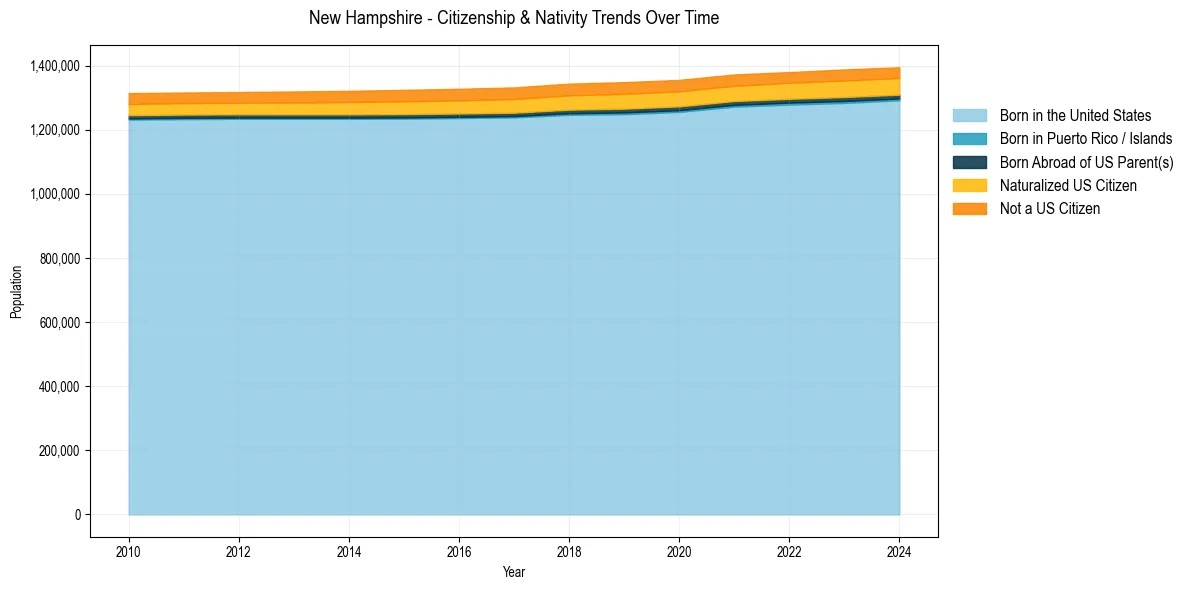
New Hampshire Population & Nativity History
| Year | Total Pop | Foreign Born | Native Born |
|---|---|---|---|
| 2024 | 1,394,868 | 6.1% | 93.9% |
| 2023 | 1,387,834 | 6.2% | 93.8% |
| 2022 | 1,379,610 | 6.0% | 94.0% |
| 2021 | 1,372,175 | 6.0% | 94.0% |
| 2020 | 1,355,244 | 6.1% | 93.9% |
| 2019 | 1,348,124 | 6.1% | 93.9% |
| 2018 | 1,343,622 | 6.0% | 94.0% |
| 2017 | 1,331,848 | 5.9% | 94.1% |
| 2016 | 1,327,503 | 5.8% | 94.2% |
| 2015 | 1,324,201 | 5.7% | 94.3% |
| 2014 | 1,321,069 | 5.6% | 94.4% |
| 2013 | 1,319,171 | 5.4% | 94.6% |
| 2012 | 1,317,474 | 5.3% | 94.7% |
| 2011 | 1,315,911 | 5.2% | 94.8% |
| 2010 | 1,313,939 | 5.3% | 94.7% |
Nativity & Citizenship FAQs for New Hampshire
Approximately 6.1% of residents in New Hampshire were born outside the United States.
The vast majority of residents, roughly 97.6%, are U.S. citizens (including both native-born and naturalized citizens).