Hillsborough County, New Hampshire Nativity & Citizenship Status (2024)
Place of birth and citizenship status analysis for Hillsborough County, New Hampshire
Hillsborough County, New Hampshire Nativity & Citizenship Indicators (2024)
Native Born
89.7%
Foreign Born
10.3%
Naturalized
5.9%
US Citizens
95.5%
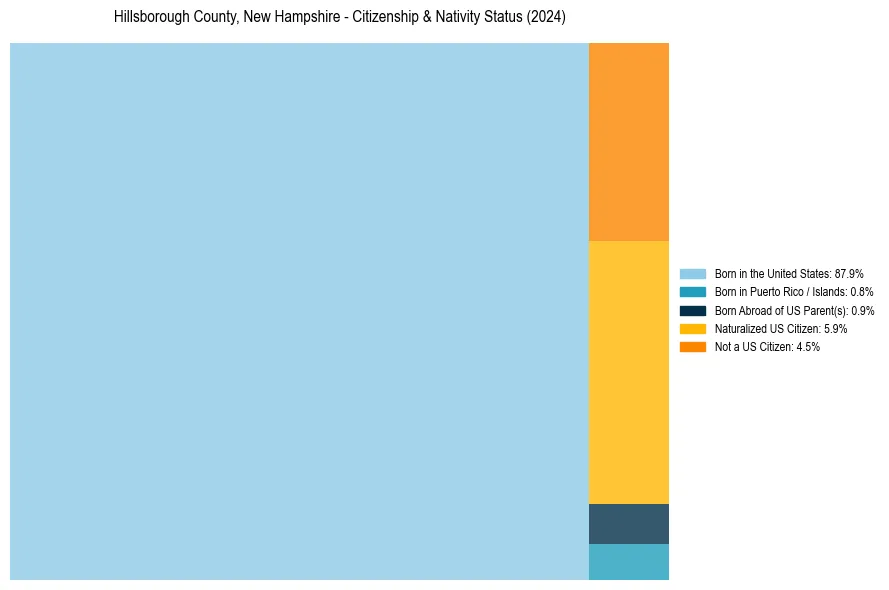
Hillsborough County, New Hampshire Nativity & Citizenship Distribution
Hillsborough County, New Hampshire Historical Nativity Trends (2010–2024)
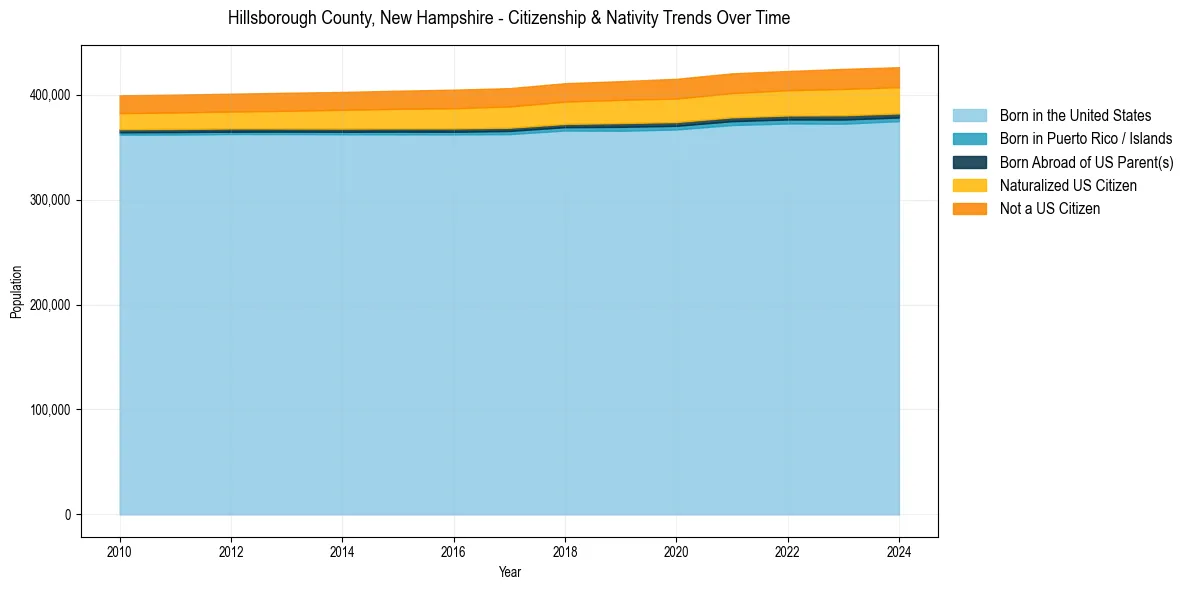
Hillsborough County, New Hampshire Population & Nativity History
| Year | Total Pop | Foreign Born | Native Born |
|---|---|---|---|
| 2024 | 426,378 | 10.3% | 89.7% |
| 2023 | 424,732 | 10.4% | 89.6% |
| 2022 | 422,733 | 10.0% | 90.0% |
| 2021 | 420,504 | 10.0% | 90.0% |
| 2020 | 415,305 | 9.9% | 90.1% |
| 2019 | 413,035 | 9.7% | 90.3% |
| 2018 | 411,087 | 9.4% | 90.6% |
| 2017 | 406,371 | 9.3% | 90.7% |
| 2016 | 404,948 | 9.1% | 90.9% |
| 2015 | 403,972 | 8.9% | 91.1% |
| 2014 | 402,776 | 8.7% | 91.3% |
| 2013 | 402,017 | 8.5% | 91.5% |
| 2012 | 401,101 | 8.3% | 91.7% |
| 2011 | 400,243 | 8.2% | 91.8% |
| 2010 | 399,555 | 8.1% | 91.9% |
Nativity & Citizenship FAQs for Hillsborough County, New Hampshire
Approximately 10.3% of residents in Hillsborough County, New Hampshire were born outside the United States.
The vast majority of residents, roughly 95.5%, are U.S. citizens (including both native-born and naturalized citizens).