Washoe County, Nevada Nativity & Citizenship Status (2024)
Place of birth and citizenship status analysis for Washoe County, Nevada
Washoe County, Nevada Nativity & Citizenship Indicators (2024)
Native Born
85.7%
Foreign Born
14.3%
Naturalized
6.9%
US Citizens
92.6%
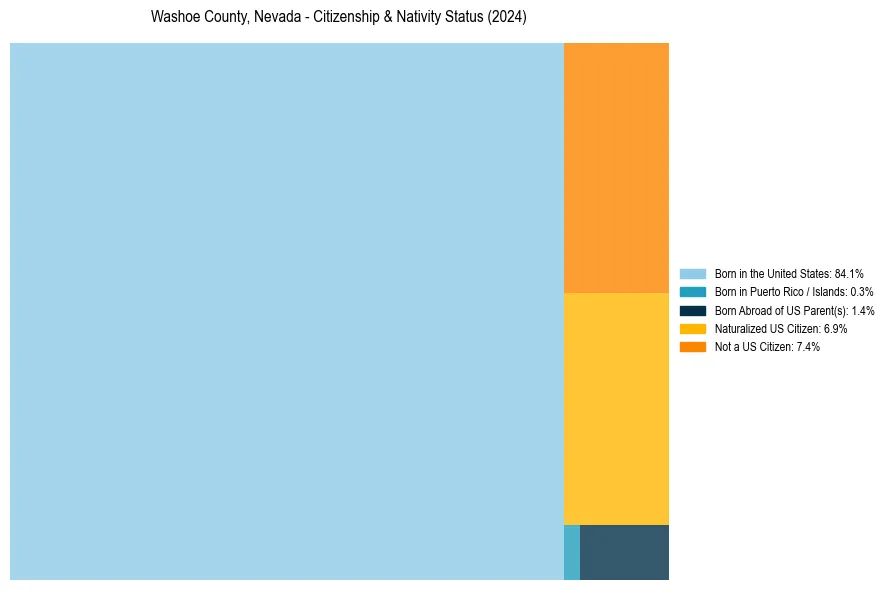
Washoe County, Nevada Nativity & Citizenship Distribution
Washoe County, Nevada Historical Nativity Trends (2010–2024)
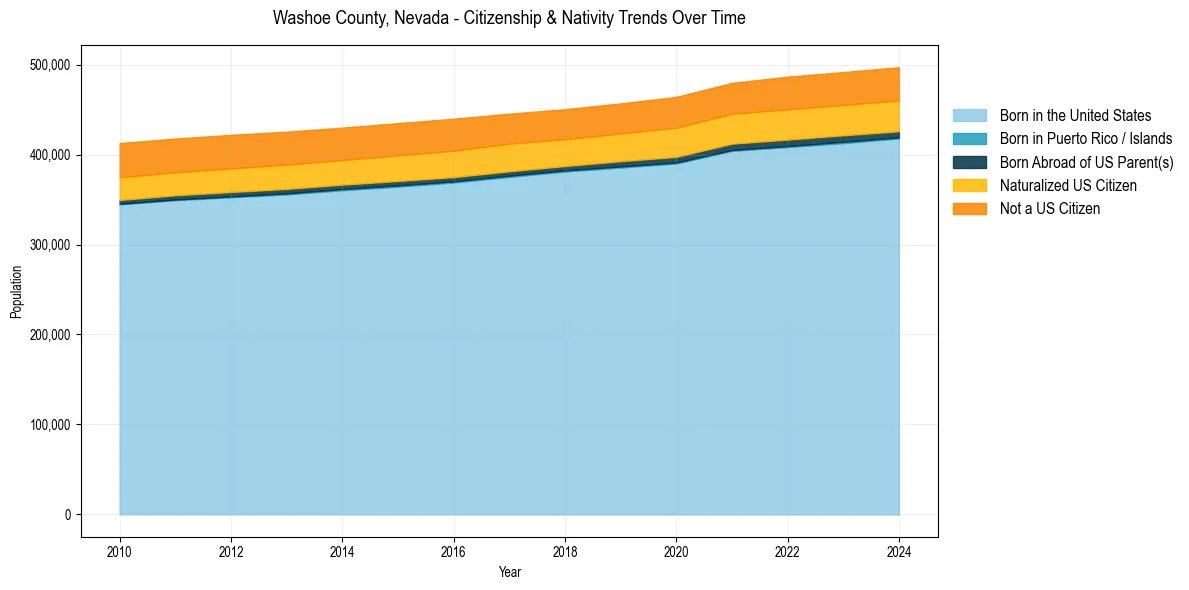
Washoe County, Nevada Population & Nativity History
| Year | Total Pop | Foreign Born | Native Born |
|---|---|---|---|
| 2024 | 497,200 | 14.3% | 85.7% |
| 2023 | 491,770 | 14.3% | 85.7% |
| 2022 | 486,674 | 14.4% | 85.6% |
| 2021 | 479,758 | 14.1% | 85.9% |
| 2020 | 464,182 | 14.4% | 85.6% |
| 2019 | 456,936 | 14.1% | 85.9% |
| 2018 | 450,486 | 14.0% | 86.0% |
| 2017 | 445,551 | 14.4% | 85.6% |
| 2016 | 439,914 | 14.8% | 85.2% |
| 2015 | 435,019 | 14.8% | 85.2% |
| 2014 | 429,985 | 14.7% | 85.3% |
| 2013 | 425,495 | 14.9% | 85.1% |
| 2012 | 422,010 | 15.1% | 84.9% |
| 2011 | 417,855 | 15.1% | 84.9% |
| 2010 | 412,844 | 15.3% | 84.7% |
Nativity & Citizenship FAQs for Washoe County, Nevada
Approximately 14.3% of residents in Washoe County, Nevada were born outside the United States.
The vast majority of residents, roughly 92.6%, are U.S. citizens (including both native-born and naturalized citizens).