Pershing County, Nevada Nativity & Citizenship Status (2024)
Place of birth and citizenship status analysis for Pershing County, Nevada
Pershing County, Nevada Nativity & Citizenship Indicators (2024)
Native Born
91.6%
Foreign Born
8.4%
Naturalized
2.6%
US Citizens
94.2%
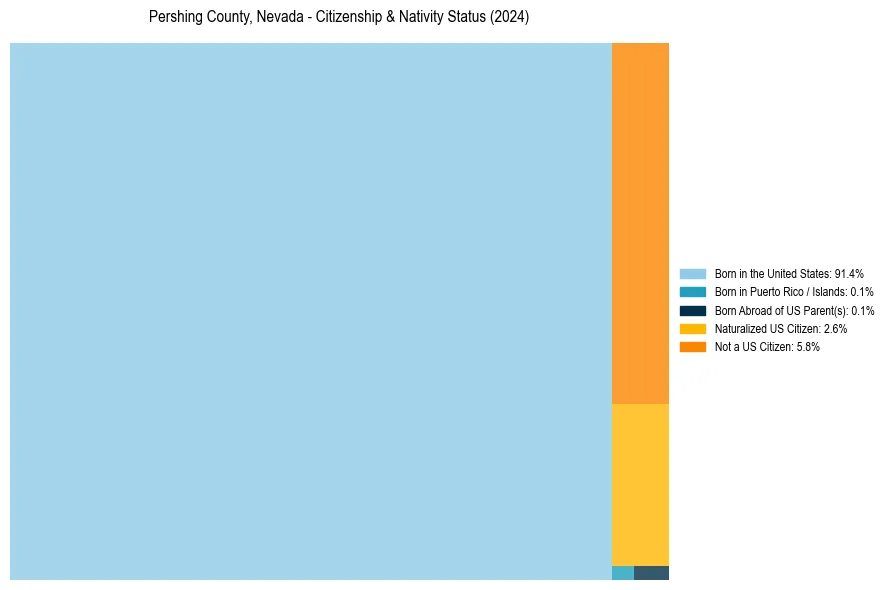
Pershing County, Nevada Nativity & Citizenship Distribution
Pershing County, Nevada Historical Nativity Trends (2010–2024)
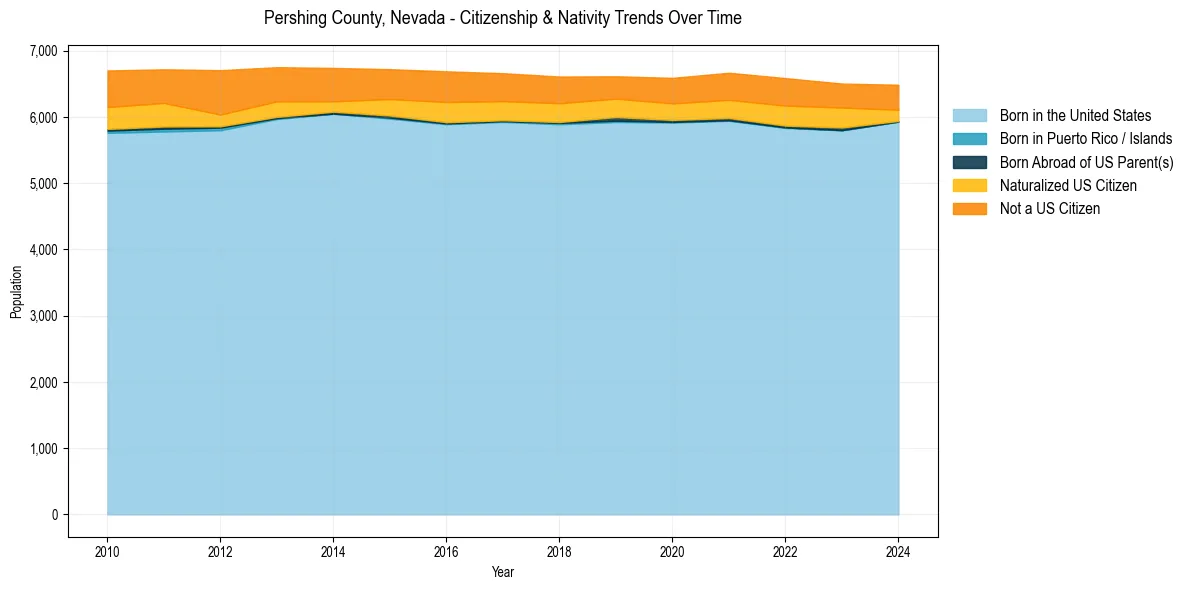
Pershing County, Nevada Population & Nativity History
| Year | Total Pop | Foreign Born | Native Born |
|---|---|---|---|
| 2024 | 6,487 | 8.4% | 91.6% |
| 2023 | 6,505 | 10.2% | 89.8% |
| 2022 | 6,587 | 10.9% | 89.1% |
| 2021 | 6,668 | 10.2% | 89.8% |
| 2020 | 6,591 | 9.6% | 90.4% |
| 2019 | 6,615 | 9.3% | 90.7% |
| 2018 | 6,611 | 10.4% | 89.6% |
| 2017 | 6,661 | 10.7% | 89.3% |
| 2016 | 6,690 | 11.5% | 88.5% |
| 2015 | 6,722 | 10.4% | 89.6% |
| 2014 | 6,741 | 9.8% | 90.2% |
| 2013 | 6,752 | 11.1% | 88.9% |
| 2012 | 6,707 | 12.6% | 87.4% |
| 2011 | 6,720 | 12.8% | 87.2% |
| 2010 | 6,703 | 13.2% | 86.8% |
Nativity & Citizenship FAQs for Pershing County, Nevada
Approximately 8.4% of residents in Pershing County, Nevada were born outside the United States.
The vast majority of residents, roughly 94.2%, are U.S. citizens (including both native-born and naturalized citizens).