Nye County, Nevada Nativity & Citizenship Status (2024)
Place of birth and citizenship status analysis for Nye County, Nevada
Nye County, Nevada Nativity & Citizenship Indicators (2024)
Native Born
91.9%
Foreign Born
8.1%
Naturalized
4.3%
US Citizens
96.2%
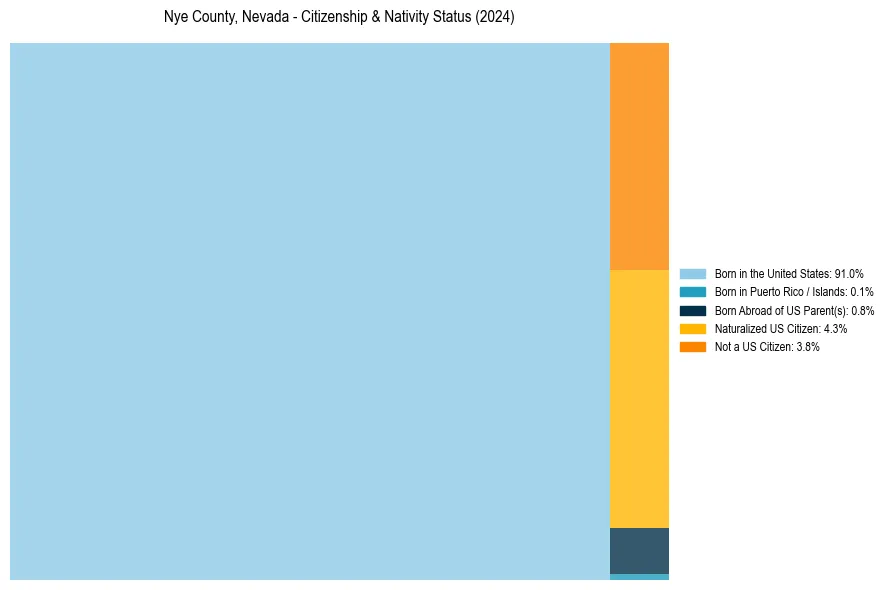
Nye County, Nevada Nativity & Citizenship Distribution
Nye County, Nevada Historical Nativity Trends (2010–2024)
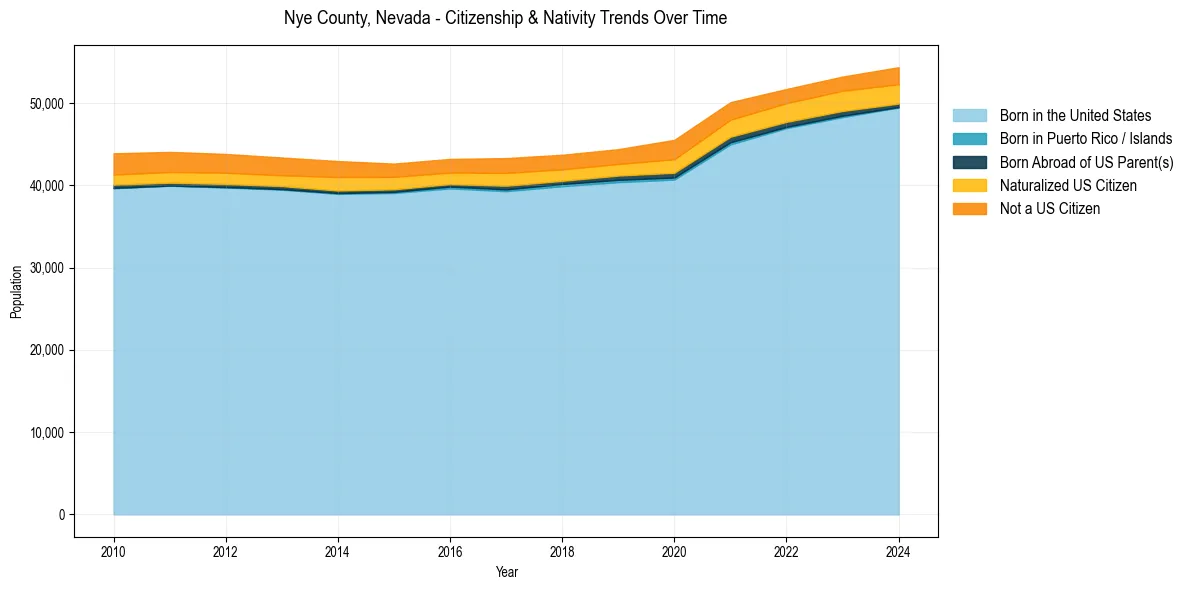
Nye County, Nevada Population & Nativity History
| Year | Total Pop | Foreign Born | Native Born |
|---|---|---|---|
| 2024 | 54,344 | 8.1% | 91.9% |
| 2023 | 53,207 | 7.9% | 92.1% |
| 2022 | 51,698 | 7.7% | 92.3% |
| 2021 | 50,096 | 8.4% | 91.6% |
| 2020 | 45,514 | 8.8% | 91.2% |
| 2019 | 44,380 | 7.2% | 92.8% |
| 2018 | 43,705 | 7.3% | 92.7% |
| 2017 | 43,296 | 7.8% | 92.2% |
| 2016 | 43,198 | 7.1% | 92.9% |
| 2015 | 42,625 | 7.3% | 92.7% |
| 2014 | 42,938 | 8.3% | 91.7% |
| 2013 | 43,368 | 8.0% | 92.0% |
| 2012 | 43,801 | 8.3% | 91.7% |
| 2011 | 44,052 | 8.5% | 91.5% |
| 2010 | 43,878 | 8.7% | 91.3% |
Nativity & Citizenship FAQs for Nye County, Nevada
Approximately 8.1% of residents in Nye County, Nevada were born outside the United States.
The vast majority of residents, roughly 96.2%, are U.S. citizens (including both native-born and naturalized citizens).