Nevada Nativity & Citizenship Status (2024)
Place of birth and citizenship status analysis for Nevada
Nevada Nativity & Citizenship Indicators (2024)
Native Born
80.9%
Foreign Born
19.1%
Naturalized
10.2%
US Citizens
91.1%
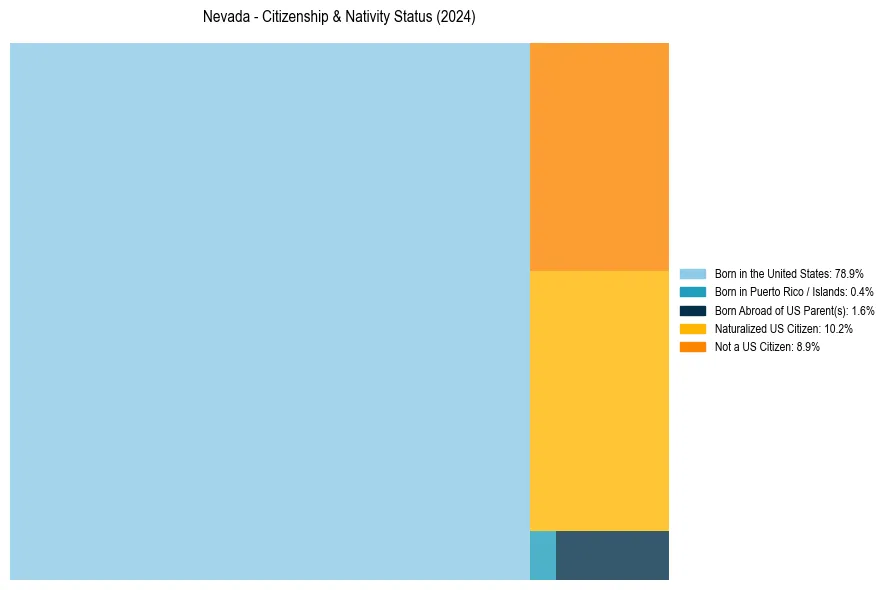
Nevada Nativity & Citizenship Distribution
Nevada Historical Nativity Trends (2010–2024)
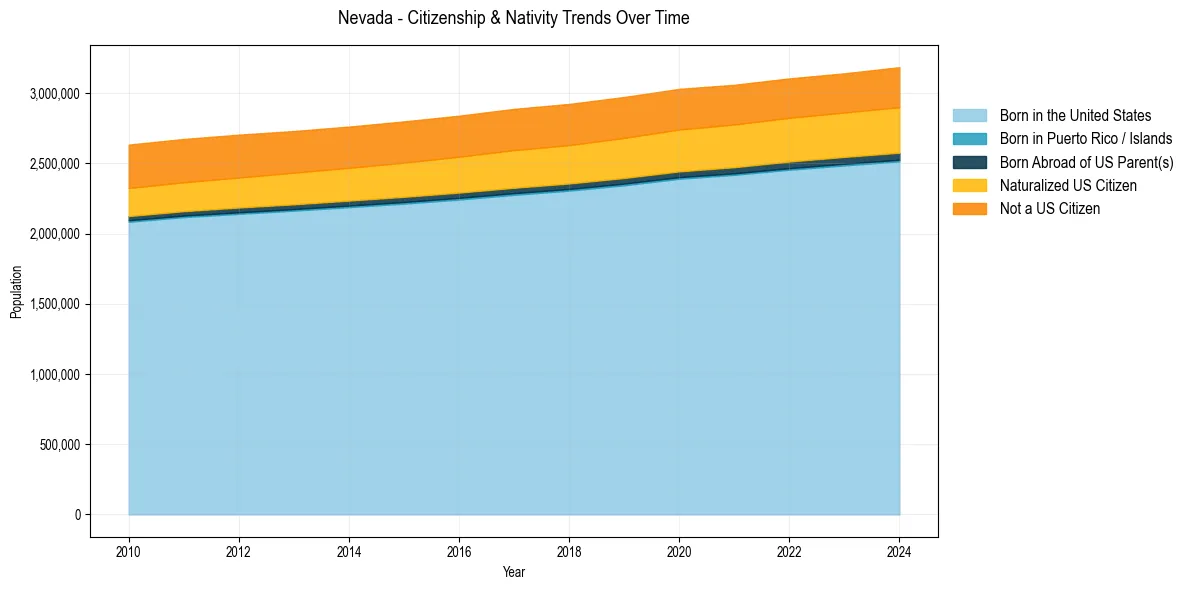
Nevada Population & Nativity History
| Year | Total Pop | Foreign Born | Native Born |
|---|---|---|---|
| 2024 | 3,184,612 | 19.1% | 80.9% |
| 2023 | 3,141,000 | 19.0% | 81.0% |
| 2022 | 3,104,817 | 19.1% | 80.9% |
| 2021 | 3,059,238 | 19.2% | 80.8% |
| 2020 | 3,030,281 | 19.4% | 80.6% |
| 2019 | 2,972,382 | 19.4% | 80.6% |
| 2018 | 2,922,849 | 19.4% | 80.6% |
| 2017 | 2,887,725 | 19.5% | 80.5% |
| 2016 | 2,839,172 | 19.3% | 80.7% |
| 2015 | 2,798,636 | 19.2% | 80.8% |
| 2014 | 2,761,584 | 19.1% | 80.9% |
| 2013 | 2,730,066 | 19.1% | 80.9% |
| 2012 | 2,704,204 | 19.2% | 80.8% |
| 2011 | 2,673,396 | 19.2% | 80.8% |
| 2010 | 2,633,331 | 19.3% | 80.7% |
Nativity & Citizenship FAQs for Nevada
Approximately 19.1% of residents in Nevada were born outside the United States.
The vast majority of residents, roughly 91.1%, are U.S. citizens (including both native-born and naturalized citizens).