Lyon County, Nevada Nativity & Citizenship Status (2024)
Place of birth and citizenship status analysis for Lyon County, Nevada
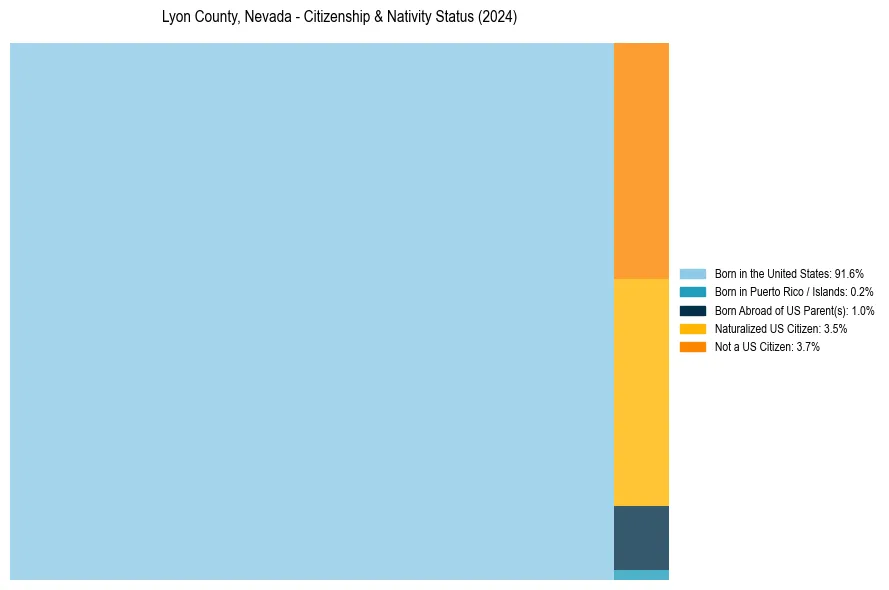
Lyon County, Nevada Nativity & Citizenship Indicators (2024)
Native Born
92.8%
Foreign Born
7.2%
Naturalized
3.5%
US Citizens
96.3%
Lyon County, Nevada Nativity & Citizenship Distribution
Lyon County, Nevada Historical Nativity Trends (2010–2024)
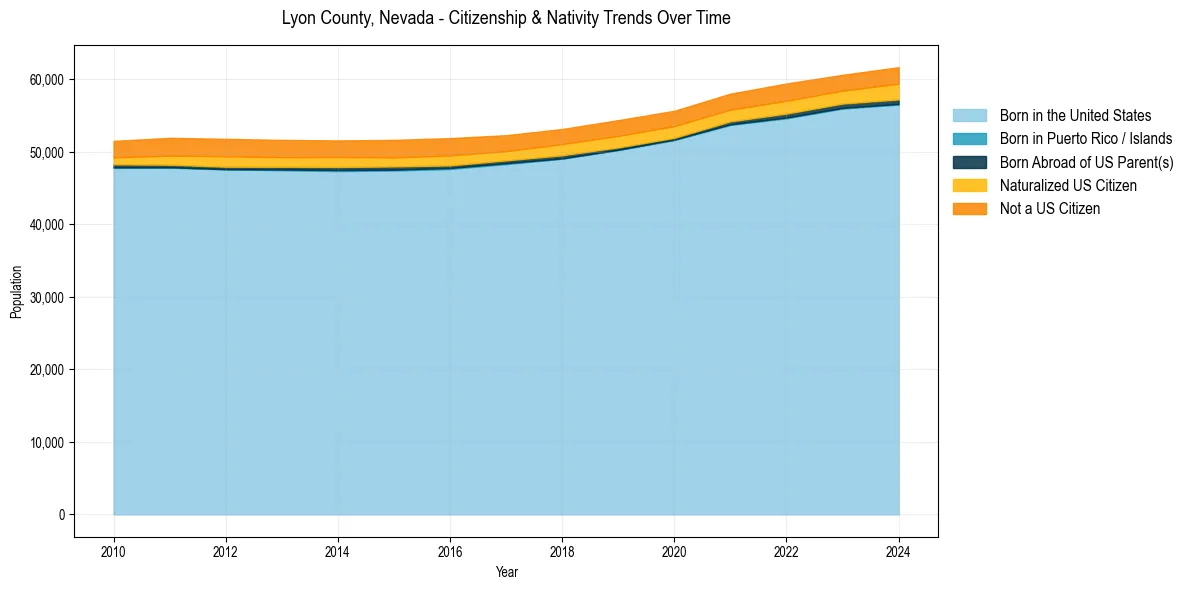
Lyon County, Nevada Population & Nativity History
| Year | Total Pop | Foreign Born | Native Born |
|---|---|---|---|
| 2024 | 61,680 | 7.2% | 92.8% |
| 2023 | 60,630 | 6.5% | 93.5% |
| 2022 | 59,435 | 7.0% | 93.0% |
| 2021 | 58,029 | 6.6% | 93.4% |
| 2020 | 55,667 | 6.7% | 93.3% |
| 2019 | 54,380 | 6.9% | 93.1% |
| 2018 | 53,155 | 6.8% | 93.2% |
| 2017 | 52,303 | 6.6% | 93.4% |
| 2016 | 51,897 | 7.3% | 92.7% |
| 2015 | 51,657 | 7.1% | 92.9% |
| 2014 | 51,579 | 7.1% | 92.9% |
| 2013 | 51,648 | 7.2% | 92.8% |
| 2012 | 51,797 | 7.4% | 92.6% |
| 2011 | 51,937 | 7.1% | 92.9% |
| 2010 | 51,515 | 6.3% | 93.7% |
Nativity & Citizenship FAQs for Lyon County, Nevada
Approximately 7.2% of residents in Lyon County, Nevada were born outside the United States.
The vast majority of residents, roughly 96.3%, are U.S. citizens (including both native-born and naturalized citizens).