Humboldt County, Nevada Nativity & Citizenship Status (2024)
Place of birth and citizenship status analysis for Humboldt County, Nevada
Humboldt County, Nevada Nativity & Citizenship Indicators (2024)
Native Born
90.6%
Foreign Born
9.4%
Naturalized
5.7%
US Citizens
96.3%
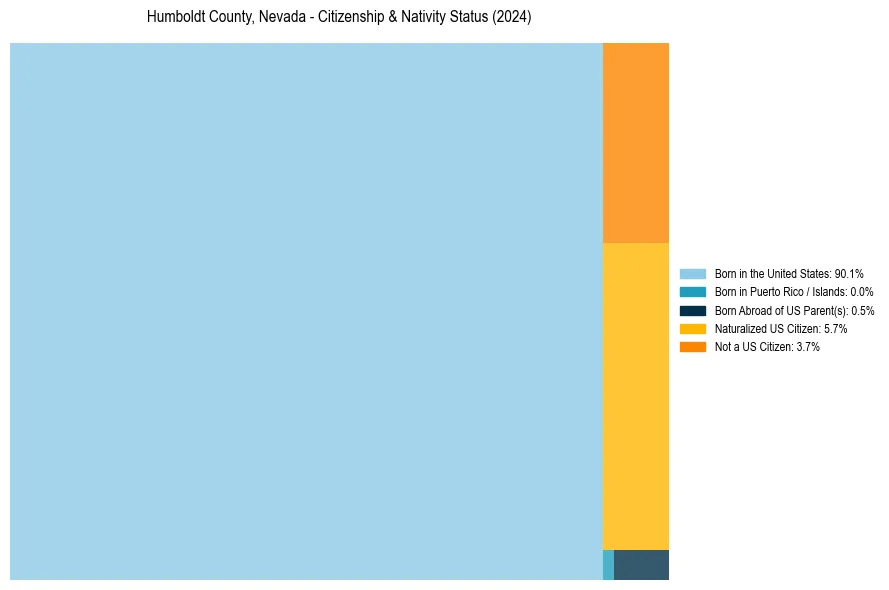
Humboldt County, Nevada Nativity & Citizenship Distribution
Humboldt County, Nevada Historical Nativity Trends (2010–2024)
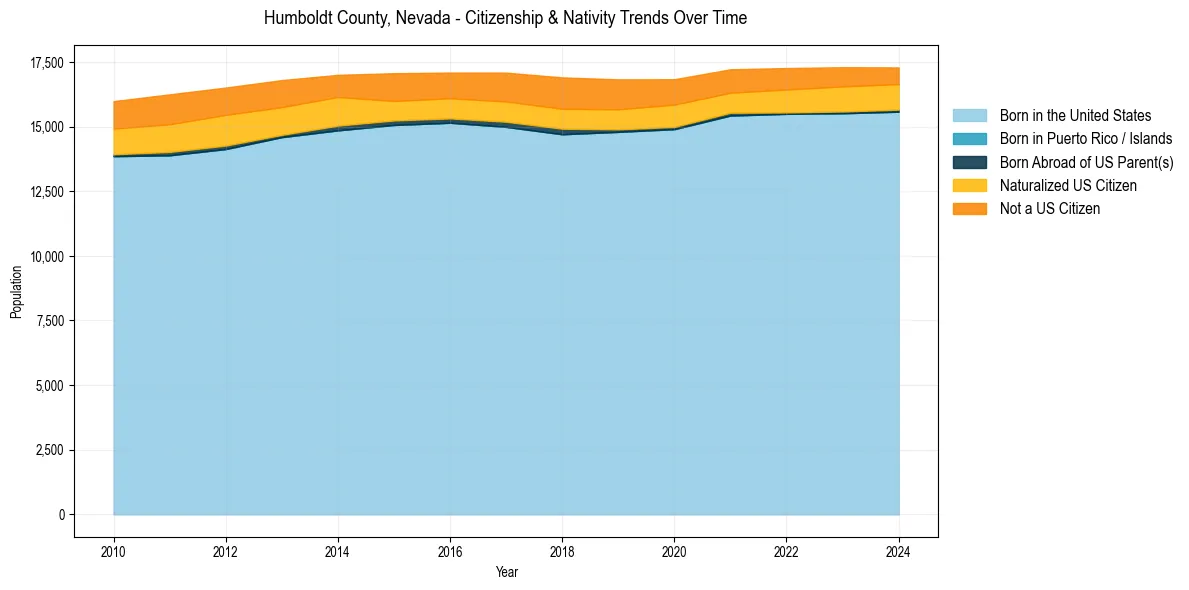
Humboldt County, Nevada Population & Nativity History
| Year | Total Pop | Foreign Born | Native Born |
|---|---|---|---|
| 2024 | 17,289 | 9.4% | 90.6% |
| 2023 | 17,299 | 9.9% | 90.1% |
| 2022 | 17,266 | 10.0% | 90.0% |
| 2021 | 17,218 | 9.8% | 90.2% |
| 2020 | 16,834 | 11.0% | 89.0% |
| 2019 | 16,828 | 11.5% | 88.5% |
| 2018 | 16,904 | 11.7% | 88.3% |
| 2017 | 17,088 | 11.1% | 88.9% |
| 2016 | 17,091 | 10.4% | 89.6% |
| 2015 | 17,067 | 10.7% | 89.3% |
| 2014 | 17,003 | 11.6% | 88.4% |
| 2013 | 16,800 | 12.6% | 87.4% |
| 2012 | 16,511 | 13.6% | 86.4% |
| 2011 | 16,249 | 13.7% | 86.3% |
| 2010 | 15,986 | 12.9% | 87.1% |
Nativity & Citizenship FAQs for Humboldt County, Nevada
Approximately 9.4% of residents in Humboldt County, Nevada were born outside the United States.
The vast majority of residents, roughly 96.3%, are U.S. citizens (including both native-born and naturalized citizens).