Clark County, Nevada Nativity & Citizenship Status (2024)
Place of birth and citizenship status analysis for Clark County, Nevada
Clark County, Nevada Nativity & Citizenship Indicators (2024)
Native Born
78.1%
Foreign Born
21.9%
Naturalized
11.8%
US Citizens
90.0%
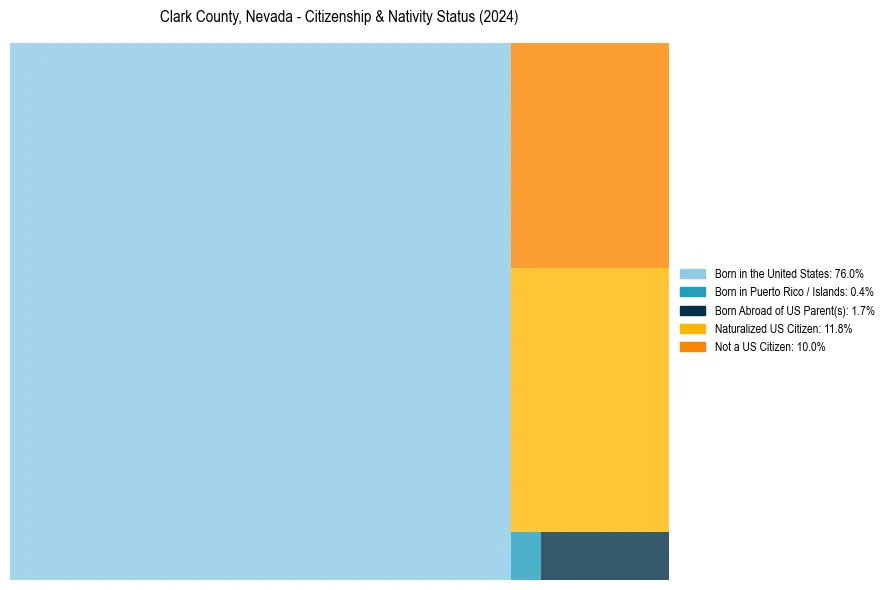
Clark County, Nevada Nativity & Citizenship Distribution
Clark County, Nevada Historical Nativity Trends (2010–2024)
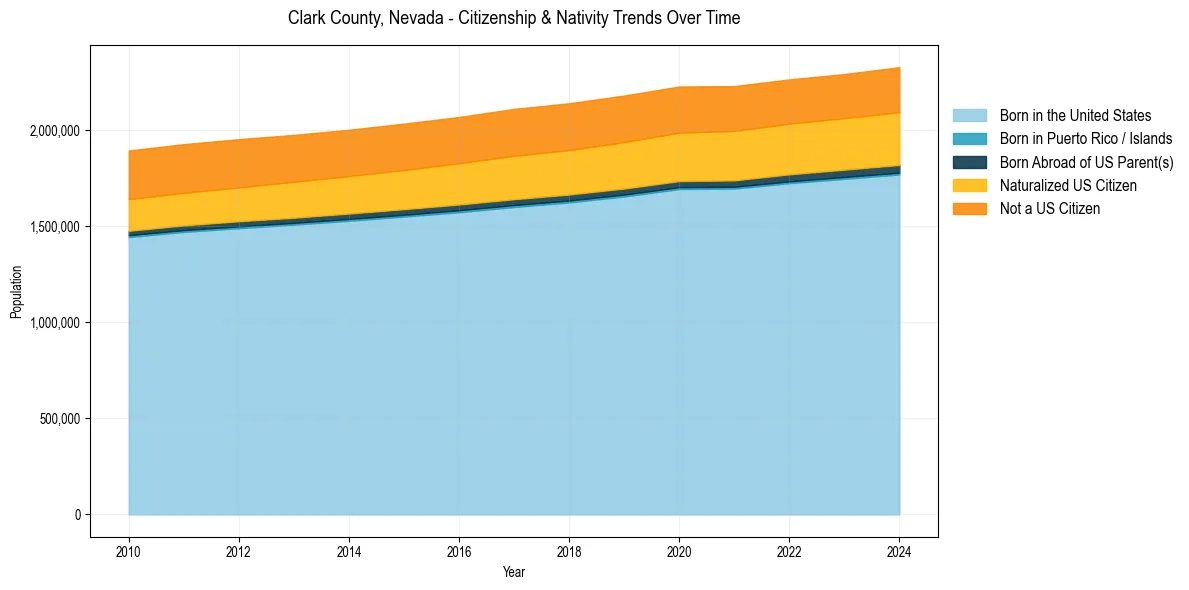
Clark County, Nevada Population & Nativity History
| Year | Total Pop | Foreign Born | Native Born |
|---|---|---|---|
| 2024 | 2,329,548 | 21.9% | 78.1% |
| 2023 | 2,293,764 | 21.7% | 78.3% |
| 2022 | 2,265,926 | 21.8% | 78.2% |
| 2021 | 2,231,147 | 22.0% | 78.0% |
| 2020 | 2,228,866 | 22.1% | 77.9% |
| 2019 | 2,182,004 | 22.2% | 77.8% |
| 2018 | 2,141,574 | 22.2% | 77.8% |
| 2017 | 2,112,436 | 22.3% | 77.7% |
| 2016 | 2,070,153 | 22.0% | 78.0% |
| 2015 | 2,035,572 | 21.9% | 78.1% |
| 2014 | 2,003,613 | 21.8% | 78.2% |
| 2013 | 1,976,925 | 21.8% | 78.2% |
| 2012 | 1,954,773 | 21.9% | 78.1% |
| 2011 | 1,928,695 | 21.9% | 78.1% |
| 2010 | 1,895,521 | 22.1% | 77.9% |
Nativity & Citizenship FAQs for Clark County, Nevada
Approximately 21.9% of residents in Clark County, Nevada were born outside the United States.
The vast majority of residents, roughly 90.0%, are U.S. citizens (including both native-born and naturalized citizens).