Churchill County, Nevada Nativity & Citizenship Status (2024)
Place of birth and citizenship status analysis for Churchill County, Nevada
Churchill County, Nevada Nativity & Citizenship Indicators (2024)
Native Born
94.7%
Foreign Born
5.3%
Naturalized
3.8%
US Citizens
98.5%
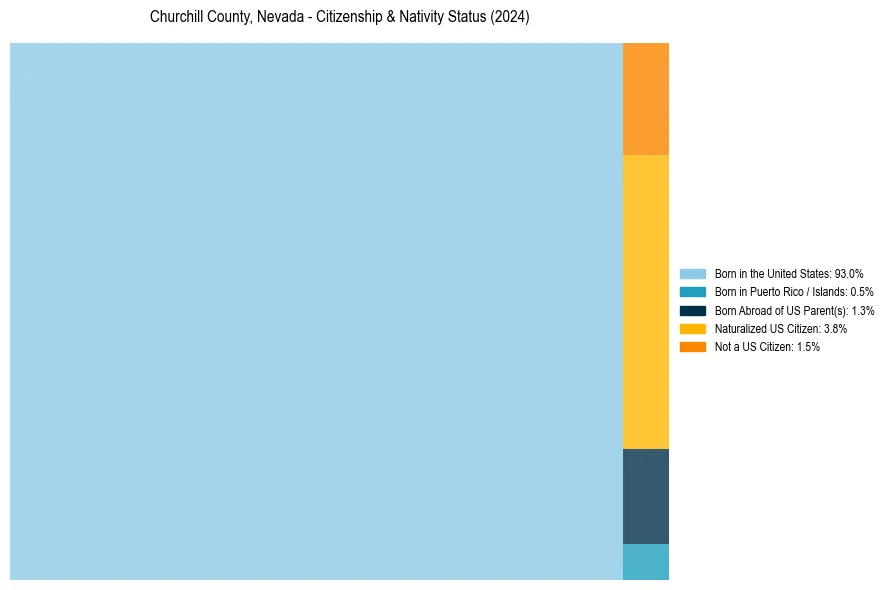
Churchill County, Nevada Nativity & Citizenship Distribution
Churchill County, Nevada Historical Nativity Trends (2010–2024)
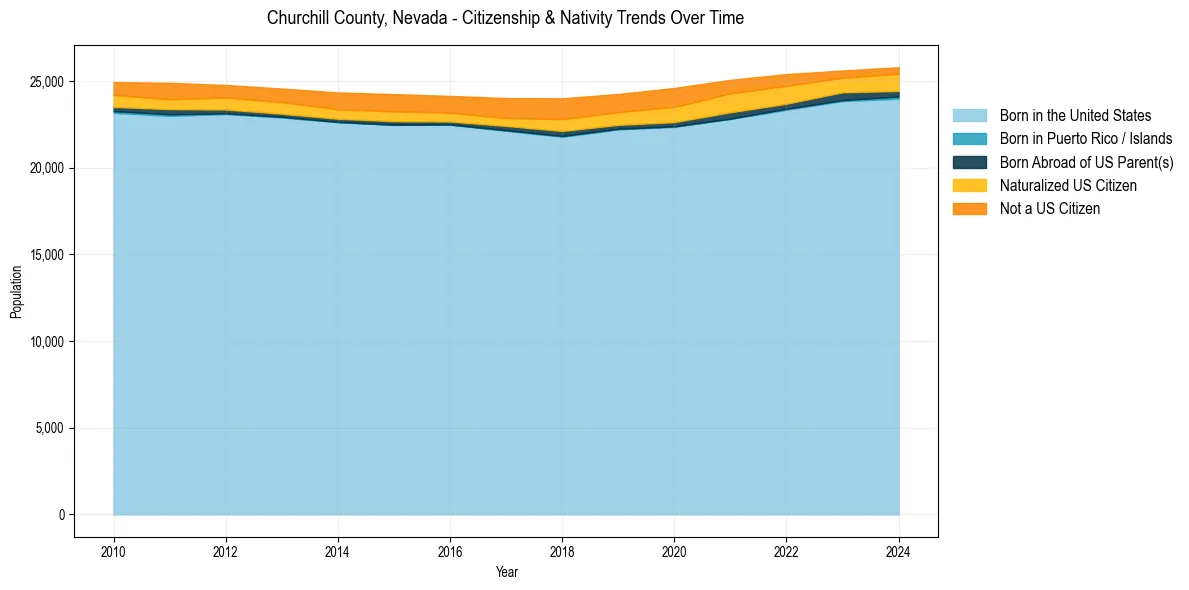
Churchill County, Nevada Population & Nativity History
| Year | Total Pop | Foreign Born | Native Born |
|---|---|---|---|
| 2024 | 25,805 | 5.3% | 94.7% |
| 2023 | 25,614 | 4.9% | 95.1% |
| 2022 | 25,409 | 6.7% | 93.3% |
| 2021 | 25,077 | 7.5% | 92.5% |
| 2020 | 24,606 | 8.0% | 92.0% |
| 2019 | 24,259 | 7.3% | 92.7% |
| 2018 | 24,010 | 7.9% | 92.1% |
| 2017 | 24,022 | 6.7% | 93.3% |
| 2016 | 24,148 | 6.1% | 93.9% |
| 2015 | 24,252 | 6.4% | 93.6% |
| 2014 | 24,347 | 6.2% | 93.8% |
| 2013 | 24,572 | 5.9% | 94.1% |
| 2012 | 24,779 | 5.7% | 94.3% |
| 2011 | 24,904 | 6.1% | 93.9% |
| 2010 | 24,946 | 5.8% | 94.2% |
Nativity & Citizenship FAQs for Churchill County, Nevada
Approximately 5.3% of residents in Churchill County, Nevada were born outside the United States.
The vast majority of residents, roughly 98.5%, are U.S. citizens (including both native-born and naturalized citizens).