Carson City, Nevada Nativity & Citizenship Status (2024)
Place of birth and citizenship status analysis for Carson City, Nevada
Carson City, Nevada Nativity & Citizenship Indicators (2024)
Native Born
87.5%
Foreign Born
12.5%
Naturalized
6.0%
US Citizens
93.6%
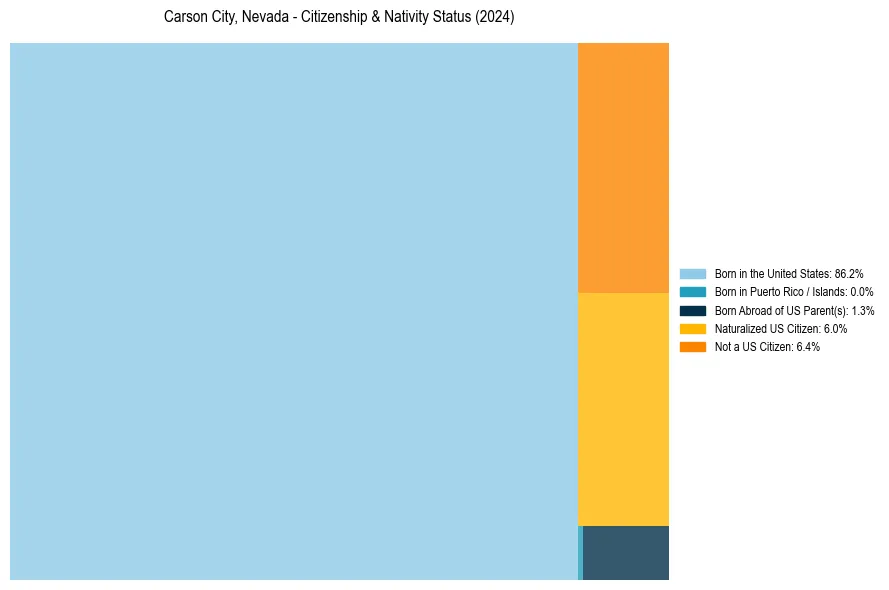
Carson City, Nevada Nativity & Citizenship Distribution
Carson City, Nevada Historical Nativity Trends (2010–2024)
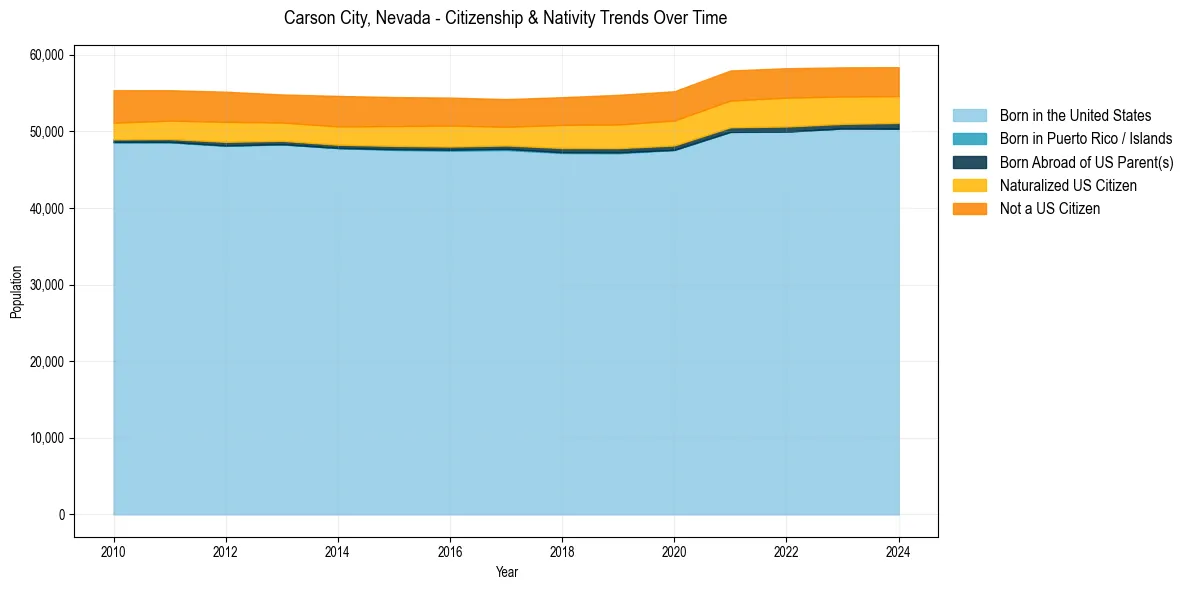
Carson City, Nevada Population & Nativity History
| Year | Total Pop | Foreign Born | Native Born |
|---|---|---|---|
| 2024 | 58,384 | 12.5% | 87.5% |
| 2023 | 58,364 | 12.6% | 87.4% |
| 2022 | 58,249 | 13.1% | 86.9% |
| 2021 | 57,957 | 12.8% | 87.2% |
| 2020 | 55,244 | 12.8% | 87.2% |
| 2019 | 54,773 | 12.7% | 87.3% |
| 2018 | 54,467 | 12.2% | 87.8% |
| 2017 | 54,219 | 11.2% | 88.8% |
| 2016 | 54,412 | 11.7% | 88.3% |
| 2015 | 54,482 | 11.7% | 88.3% |
| 2014 | 54,634 | 11.7% | 88.3% |
| 2013 | 54,821 | 11.0% | 89.0% |
| 2012 | 55,184 | 11.9% | 88.1% |
| 2011 | 55,378 | 11.5% | 88.5% |
| 2010 | 55,375 | 11.6% | 88.4% |
Nativity & Citizenship FAQs for Carson City, Nevada
Approximately 12.5% of residents in Carson City, Nevada were born outside the United States.
The vast majority of residents, roughly 93.6%, are U.S. citizens (including both native-born and naturalized citizens).