Washington County, Nebraska Nativity & Citizenship Status (2024)
Place of birth and citizenship status analysis for Washington County, Nebraska
Washington County, Nebraska Nativity & Citizenship Indicators (2024)
Native Born
97.5%
Foreign Born
2.5%
Naturalized
1.3%
US Citizens
98.8%
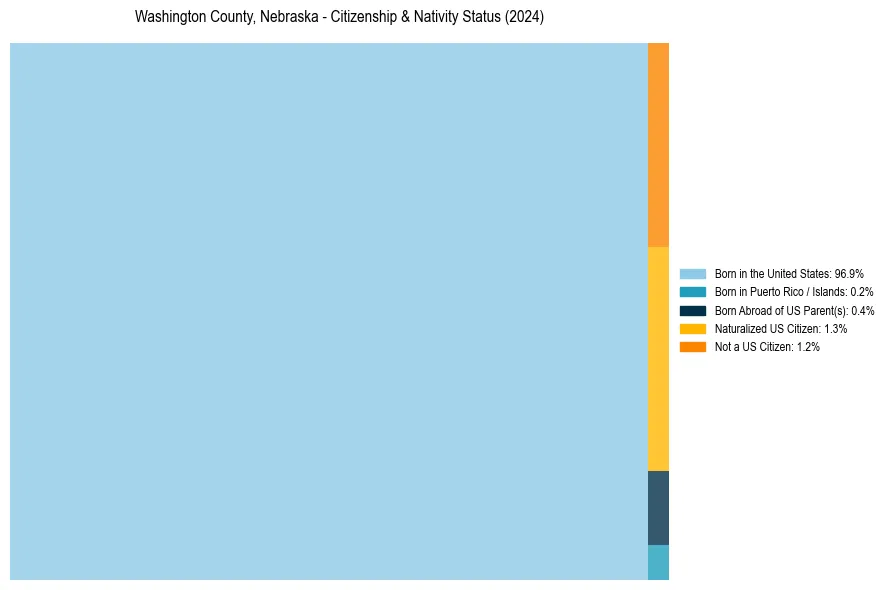
Washington County, Nebraska Nativity & Citizenship Distribution
Washington County, Nebraska Historical Nativity Trends (2010–2024)
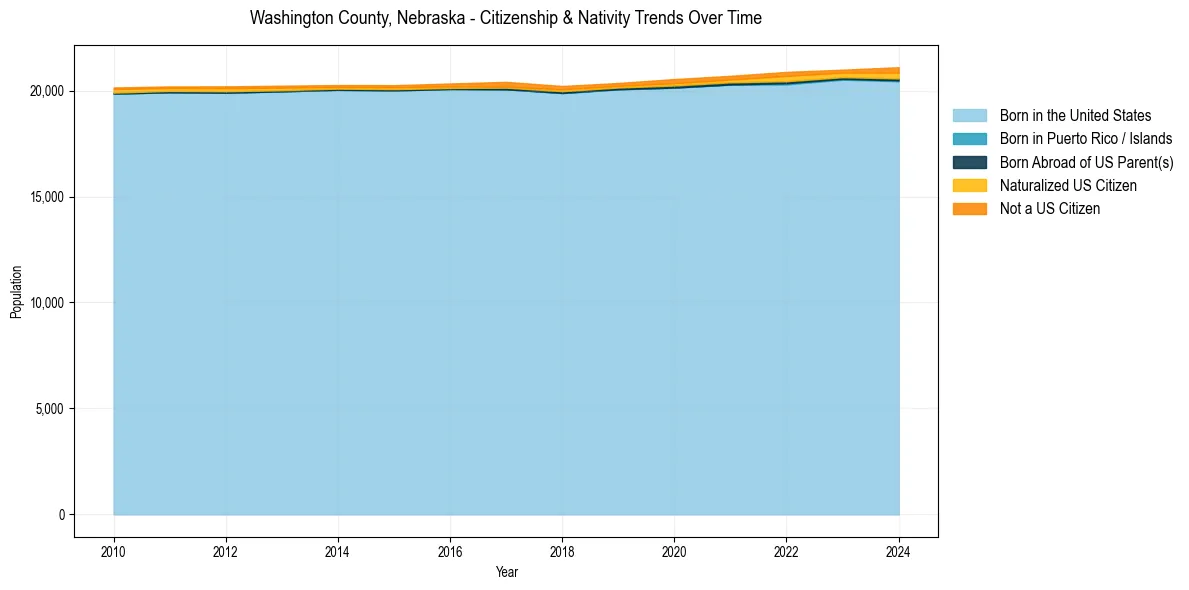
Washington County, Nebraska Population & Nativity History
| Year | Total Pop | Foreign Born | Native Born |
|---|---|---|---|
| 2024 | 21,106 | 2.5% | 97.5% |
| 2023 | 20,989 | 1.7% | 98.3% |
| 2022 | 20,884 | 2.1% | 97.9% |
| 2021 | 20,699 | 1.5% | 98.5% |
| 2020 | 20,546 | 1.5% | 98.5% |
| 2019 | 20,361 | 1.1% | 98.9% |
| 2018 | 20,219 | 1.2% | 98.8% |
| 2017 | 20,414 | 1.3% | 98.7% |
| 2016 | 20,338 | 1.0% | 99.0% |
| 2015 | 20,257 | 0.9% | 99.1% |
| 2014 | 20,264 | 0.8% | 99.2% |
| 2013 | 20,234 | 1.0% | 99.0% |
| 2012 | 20,201 | 1.2% | 98.8% |
| 2011 | 20,199 | 1.1% | 98.9% |
| 2010 | 20,148 | 1.2% | 98.8% |
Nativity & Citizenship FAQs for Washington County, Nebraska
Approximately 2.5% of residents in Washington County, Nebraska were born outside the United States.
The vast majority of residents, roughly 98.8%, are U.S. citizens (including both native-born and naturalized citizens).