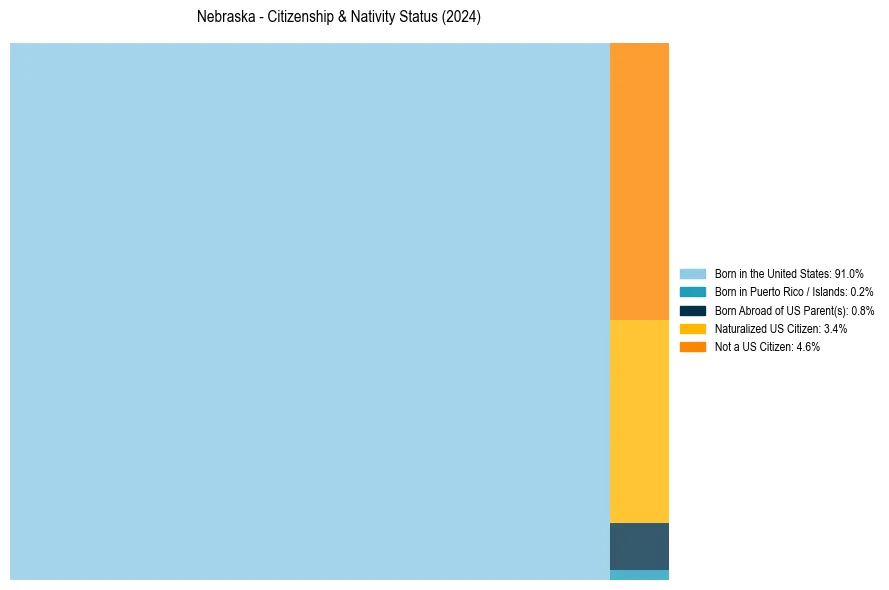
Nebraska Nativity & Citizenship Status (2024)
Place of birth and citizenship status analysis for Nebraska
Nebraska Nativity & Citizenship Indicators (2024)
Native Born
92.0%
Foreign Born
8.0%
Naturalized
3.4%
US Citizens
95.4%
Nebraska Nativity & Citizenship Distribution
Nebraska Historical Nativity Trends (2010–2024)
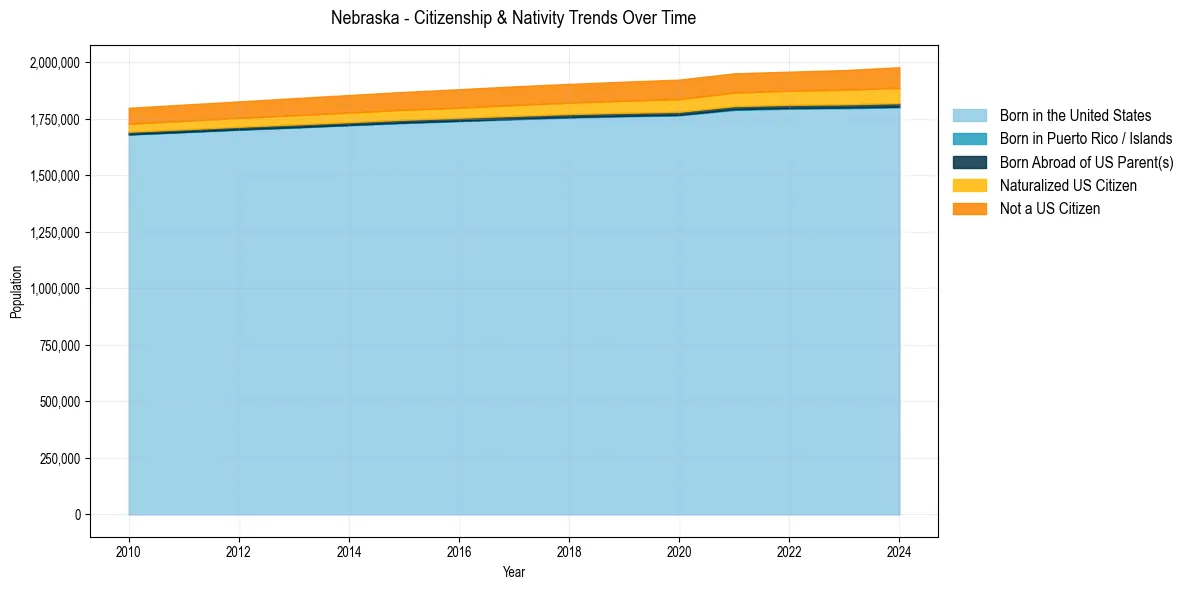
Nebraska Population & Nativity History
| Year | Total Pop | Foreign Born | Native Born |
|---|---|---|---|
| 2024 | 1,978,707 | 8.0% | 92.0% |
| 2023 | 1,965,926 | 7.7% | 92.3% |
| 2022 | 1,958,939 | 7.5% | 92.5% |
| 2021 | 1,951,480 | 7.4% | 92.6% |
| 2020 | 1,923,826 | 7.4% | 92.6% |
| 2019 | 1,914,571 | 7.2% | 92.8% |
| 2018 | 1,904,760 | 7.0% | 93.0% |
| 2017 | 1,893,921 | 6.9% | 93.1% |
| 2016 | 1,881,259 | 6.7% | 93.3% |
| 2015 | 1,869,365 | 6.6% | 93.4% |
| 2014 | 1,855,617 | 6.5% | 93.5% |
| 2013 | 1,841,625 | 6.3% | 93.7% |
| 2012 | 1,827,306 | 6.2% | 93.8% |
| 2011 | 1,813,061 | 6.0% | 94.0% |
| 2010 | 1,799,125 | 5.9% | 94.1% |
Nativity & Citizenship FAQs for Nebraska
Approximately 8.0% of residents in Nebraska were born outside the United States.
The vast majority of residents, roughly 95.4%, are U.S. citizens (including both native-born and naturalized citizens).