Nance County, Nebraska Nativity & Citizenship Status (2024)
Place of birth and citizenship status analysis for Nance County, Nebraska
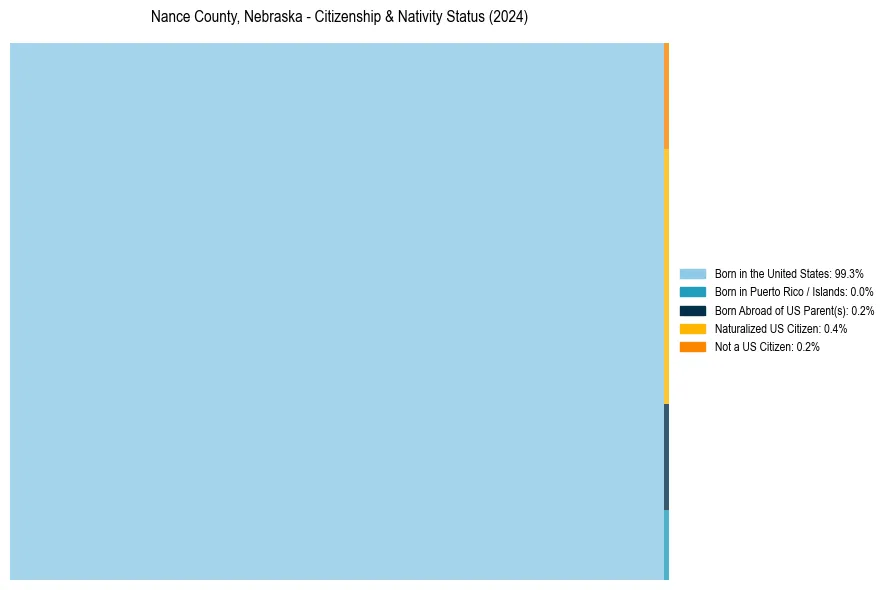
Nance County, Nebraska Nativity & Citizenship Indicators (2024)
Native Born
99.5%
Foreign Born
0.5%
Naturalized
0.4%
US Citizens
99.8%
Nance County, Nebraska Nativity & Citizenship Distribution
Nance County, Nebraska Historical Nativity Trends (2010–2024)
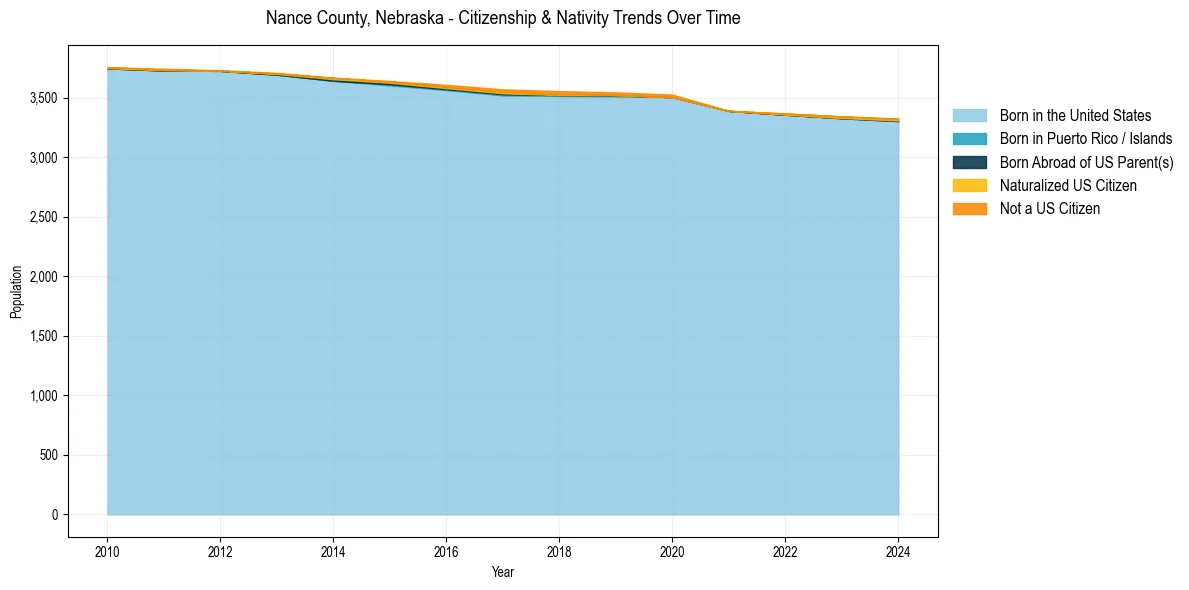
Nance County, Nebraska Population & Nativity History
| Year | Total Pop | Foreign Born | Native Born |
|---|---|---|---|
| 2024 | 3,324 | 0.5% | 99.5% |
| 2023 | 3,342 | 0.4% | 99.6% |
| 2022 | 3,366 | 0.3% | 99.7% |
| 2021 | 3,389 | 0.0% | 100.0% |
| 2020 | 3,525 | 0.6% | 99.4% |
| 2019 | 3,544 | 0.7% | 99.3% |
| 2018 | 3,554 | 0.9% | 99.1% |
| 2017 | 3,569 | 0.9% | 99.1% |
| 2016 | 3,607 | 0.8% | 99.2% |
| 2015 | 3,639 | 0.4% | 99.6% |
| 2014 | 3,667 | 0.4% | 99.6% |
| 2013 | 3,707 | 0.2% | 99.8% |
| 2012 | 3,730 | 0.1% | 99.9% |
| 2011 | 3,742 | 0.3% | 99.7% |
| 2010 | 3,755 | 0.2% | 99.8% |
Nativity & Citizenship FAQs for Nance County, Nebraska
Approximately 0.5% of residents in Nance County, Nebraska were born outside the United States.
The vast majority of residents, roughly 99.8%, are U.S. citizens (including both native-born and naturalized citizens).