Lancaster County, Nebraska Nativity & Citizenship Status (2024)
Place of birth and citizenship status analysis for Lancaster County, Nebraska
Lancaster County, Nebraska Nativity & Citizenship Indicators (2024)
Native Born
91.3%
Foreign Born
8.7%
Naturalized
4.5%
US Citizens
95.8%
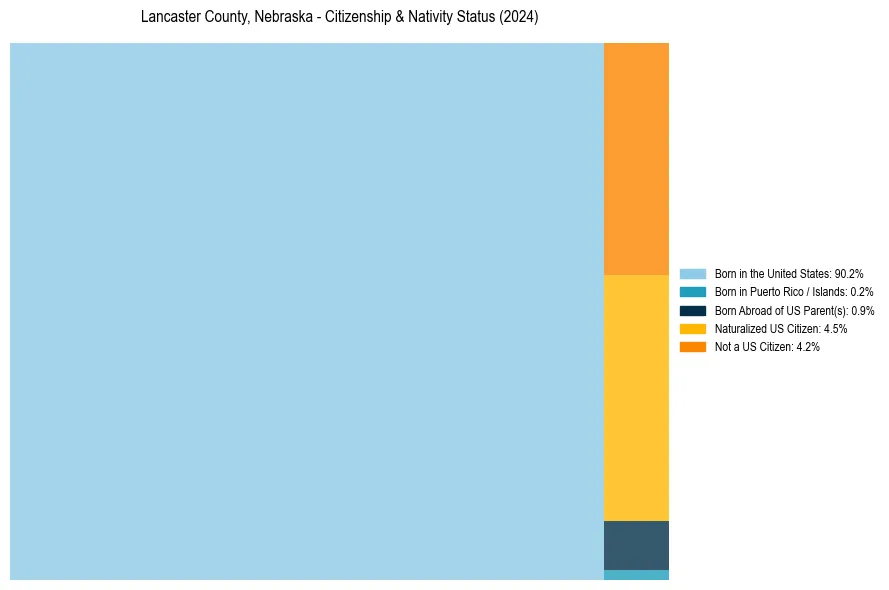
Lancaster County, Nebraska Nativity & Citizenship Distribution
Lancaster County, Nebraska Historical Nativity Trends (2010–2024)
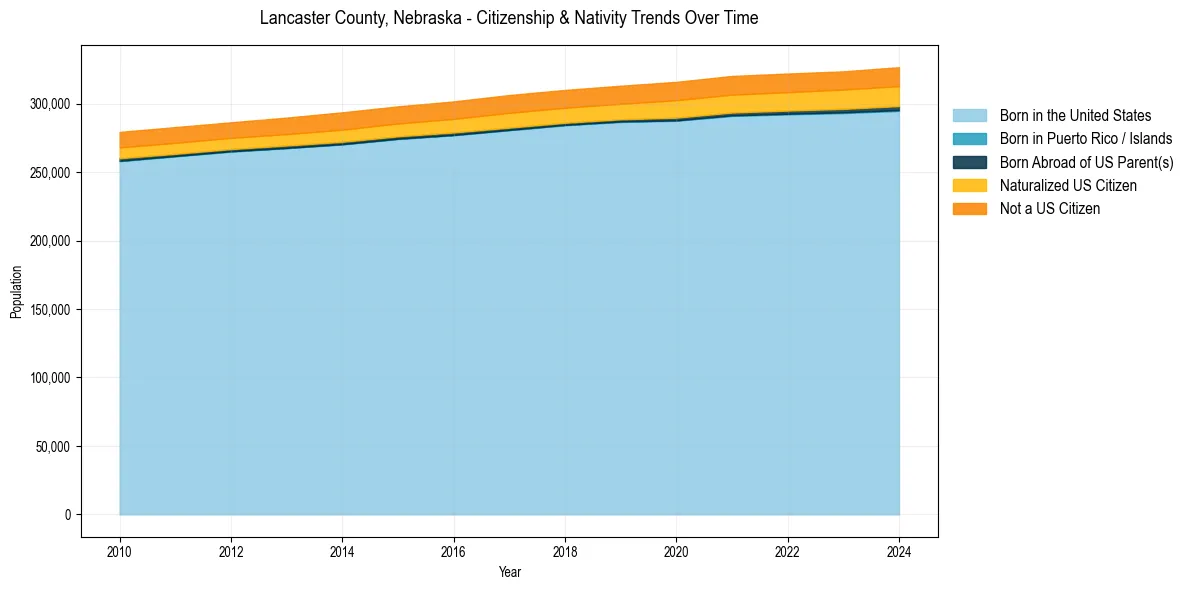
Lancaster County, Nebraska Population & Nativity History
| Year | Total Pop | Foreign Born | Native Born |
|---|---|---|---|
| 2024 | 326,696 | 8.7% | 91.3% |
| 2023 | 323,673 | 8.5% | 91.5% |
| 2022 | 322,063 | 8.4% | 91.6% |
| 2021 | 320,301 | 8.3% | 91.7% |
| 2020 | 315,976 | 8.3% | 91.7% |
| 2019 | 313,158 | 7.8% | 92.2% |
| 2018 | 310,094 | 7.7% | 92.3% |
| 2017 | 306,357 | 7.8% | 92.2% |
| 2016 | 301,707 | 7.5% | 92.5% |
| 2015 | 298,080 | 7.3% | 92.7% |
| 2014 | 293,726 | 7.3% | 92.7% |
| 2013 | 289,873 | 7.0% | 93.0% |
| 2012 | 286,425 | 6.8% | 93.2% |
| 2011 | 282,931 | 6.9% | 93.1% |
| 2010 | 279,428 | 6.9% | 93.1% |
Nativity & Citizenship FAQs for Lancaster County, Nebraska
Approximately 8.7% of residents in Lancaster County, Nebraska were born outside the United States.
The vast majority of residents, roughly 95.8%, are U.S. citizens (including both native-born and naturalized citizens).