Dawson County, Nebraska Nativity & Citizenship Status (2024)
Place of birth and citizenship status analysis for Dawson County, Nebraska
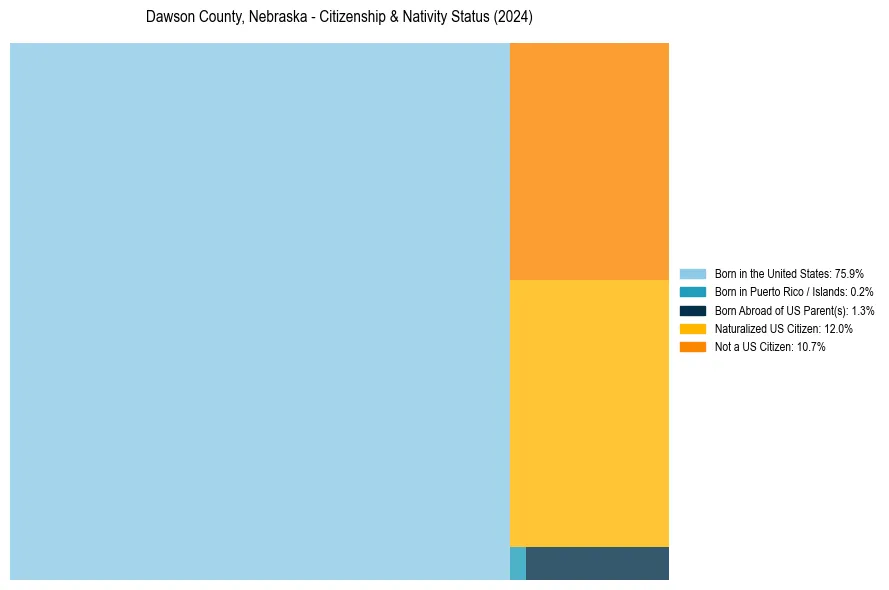
Dawson County, Nebraska Nativity & Citizenship Indicators (2024)
Native Born
77.3%
Foreign Born
22.7%
Naturalized
12.0%
US Citizens
89.3%
Dawson County, Nebraska Nativity & Citizenship Distribution
Dawson County, Nebraska Historical Nativity Trends (2010–2024)
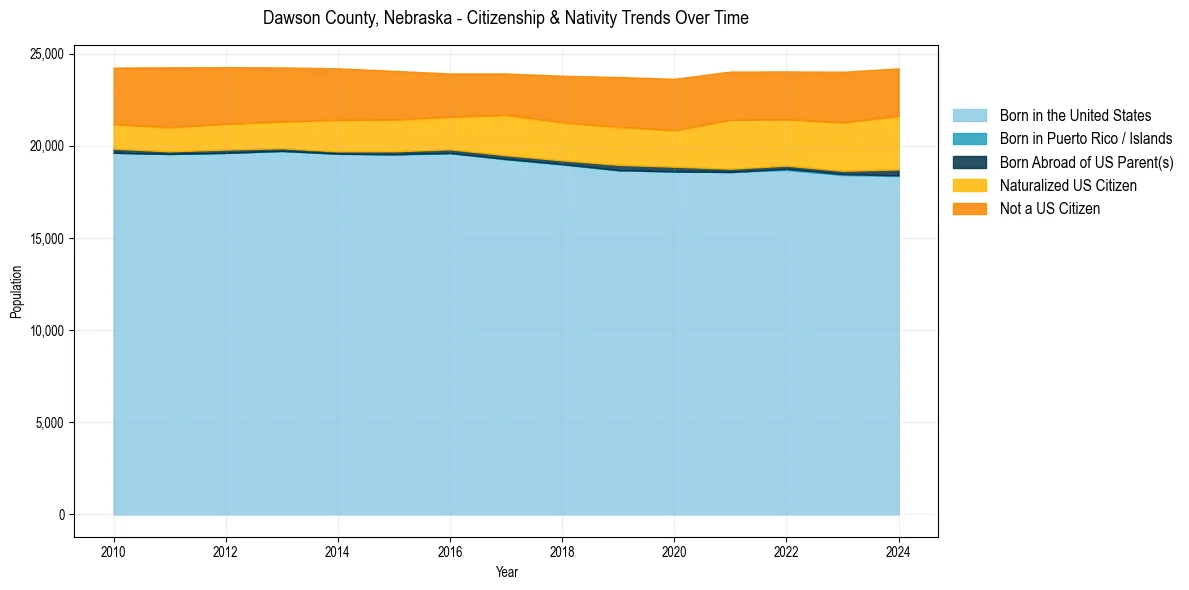
Dawson County, Nebraska Population & Nativity History
| Year | Total Pop | Foreign Born | Native Born |
|---|---|---|---|
| 2024 | 24,202 | 22.7% | 77.3% |
| 2023 | 24,020 | 22.4% | 77.6% |
| 2022 | 24,037 | 21.3% | 78.7% |
| 2021 | 24,031 | 22.0% | 78.0% |
| 2020 | 23,638 | 20.2% | 79.8% |
| 2019 | 23,733 | 20.1% | 79.9% |
| 2018 | 23,804 | 19.3% | 80.7% |
| 2017 | 23,925 | 18.5% | 81.5% |
| 2016 | 23,924 | 17.2% | 82.8% |
| 2015 | 24,069 | 18.2% | 81.8% |
| 2014 | 24,205 | 18.6% | 81.4% |
| 2013 | 24,256 | 18.1% | 81.9% |
| 2012 | 24,267 | 18.4% | 81.6% |
| 2011 | 24,261 | 18.8% | 81.2% |
| 2010 | 24,245 | 18.1% | 81.9% |
Nativity & Citizenship FAQs for Dawson County, Nebraska
Approximately 22.7% of residents in Dawson County, Nebraska were born outside the United States.
The vast majority of residents, roughly 89.3%, are U.S. citizens (including both native-born and naturalized citizens).