St. Louis County, Missouri Nativity & Citizenship Status (2024)
Place of birth and citizenship status analysis for St. Louis County, Missouri
St. Louis County, Missouri Nativity & Citizenship Indicators (2024)
Native Born
91.6%
Foreign Born
8.4%
Naturalized
4.6%
US Citizens
96.2%
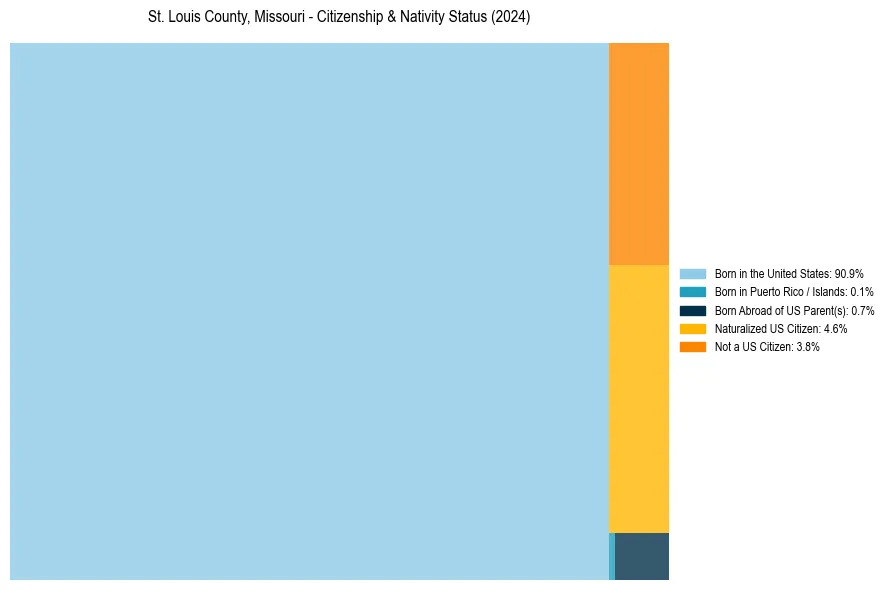
St. Louis County, Missouri Nativity & Citizenship Distribution
St. Louis County, Missouri Historical Nativity Trends (2010–2024)
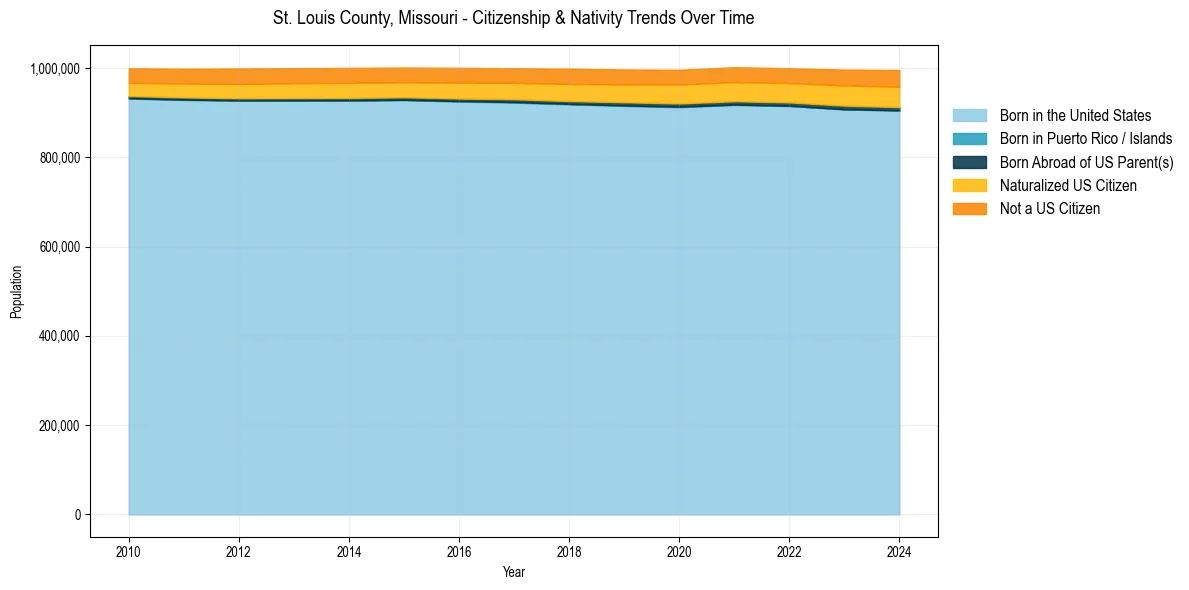
St. Louis County, Missouri Population & Nativity History
| Year | Total Pop | Foreign Born | Native Born |
|---|---|---|---|
| 2024 | 995,569 | 8.4% | 91.6% |
| 2023 | 996,618 | 8.1% | 91.9% |
| 2022 | 999,703 | 7.7% | 92.3% |
| 2021 | 1,001,982 | 7.6% | 92.4% |
| 2020 | 996,179 | 7.6% | 92.4% |
| 2019 | 996,919 | 7.4% | 92.6% |
| 2018 | 998,684 | 7.3% | 92.7% |
| 2017 | 999,539 | 6.9% | 93.1% |
| 2016 | 1,000,560 | 6.9% | 93.1% |
| 2015 | 1,001,327 | 6.7% | 93.3% |
| 2014 | 1,000,423 | 6.7% | 93.3% |
| 2013 | 999,725 | 6.7% | 93.3% |
| 2012 | 999,147 | 6.7% | 93.3% |
| 2011 | 998,760 | 6.5% | 93.5% |
| 2010 | 999,454 | 6.2% | 93.8% |
Nativity & Citizenship FAQs for St. Louis County, Missouri
Approximately 8.4% of residents in St. Louis County, Missouri were born outside the United States.
The vast majority of residents, roughly 96.2%, are U.S. citizens (including both native-born and naturalized citizens).