Howell County, Missouri Nativity & Citizenship Status (2024)
Place of birth and citizenship status analysis for Howell County, Missouri
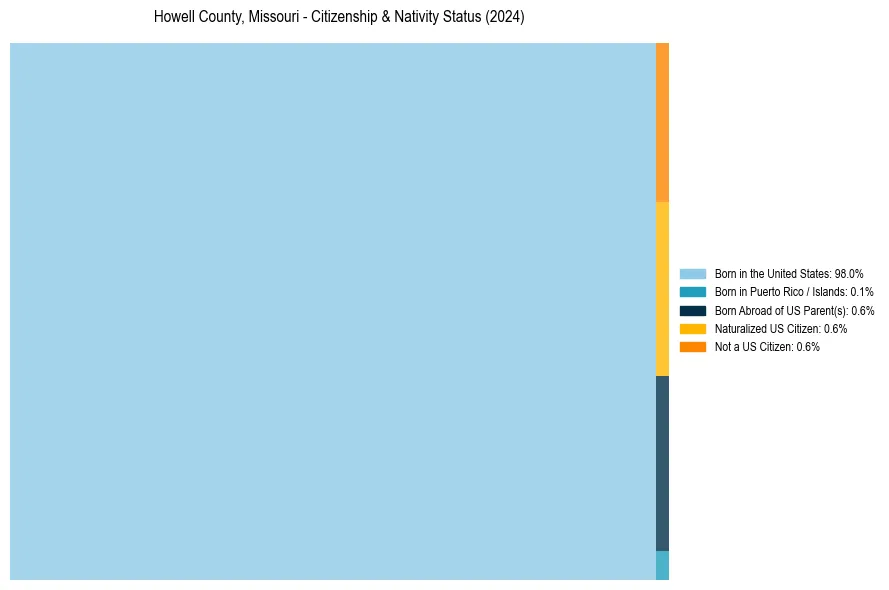
Howell County, Missouri Nativity & Citizenship Indicators (2024)
Native Born
98.8%
Foreign Born
1.2%
Naturalized
0.6%
US Citizens
99.4%
Howell County, Missouri Nativity & Citizenship Distribution
Howell County, Missouri Historical Nativity Trends (2010–2024)
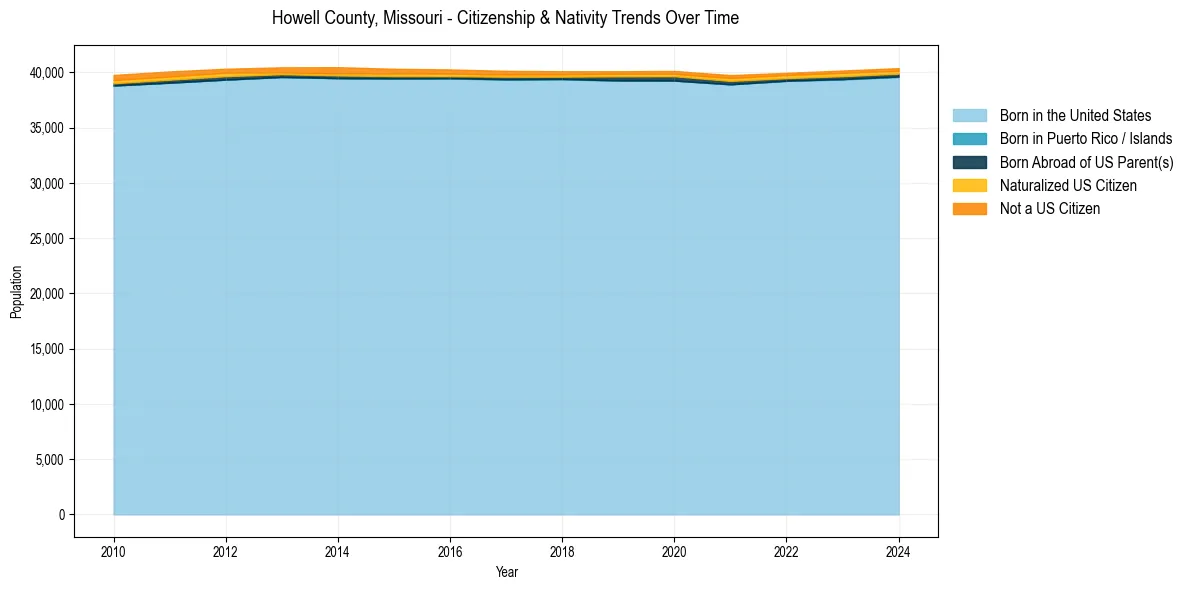
Howell County, Missouri Population & Nativity History
| Year | Total Pop | Foreign Born | Native Born |
|---|---|---|---|
| 2024 | 40,383 | 1.2% | 98.8% |
| 2023 | 40,168 | 1.3% | 98.7% |
| 2022 | 39,960 | 1.2% | 98.8% |
| 2021 | 39,753 | 1.3% | 98.7% |
| 2020 | 40,130 | 1.2% | 98.8% |
| 2019 | 40,104 | 1.2% | 98.8% |
| 2018 | 40,102 | 1.2% | 98.8% |
| 2017 | 40,139 | 1.3% | 98.7% |
| 2016 | 40,265 | 1.5% | 98.5% |
| 2015 | 40,326 | 1.7% | 98.3% |
| 2014 | 40,469 | 1.9% | 98.1% |
| 2013 | 40,458 | 1.5% | 98.5% |
| 2012 | 40,330 | 1.7% | 98.3% |
| 2011 | 40,088 | 1.9% | 98.1% |
| 2010 | 39,763 | 1.9% | 98.1% |
Nativity & Citizenship FAQs for Howell County, Missouri
Approximately 1.2% of residents in Howell County, Missouri were born outside the United States.
The vast majority of residents, roughly 99.4%, are U.S. citizens (including both native-born and naturalized citizens).