Greene County, Missouri Nativity & Citizenship Status (2024)
Place of birth and citizenship status analysis for Greene County, Missouri
Greene County, Missouri Nativity & Citizenship Indicators (2024)
Native Born
96.2%
Foreign Born
3.8%
Naturalized
2.0%
US Citizens
98.2%
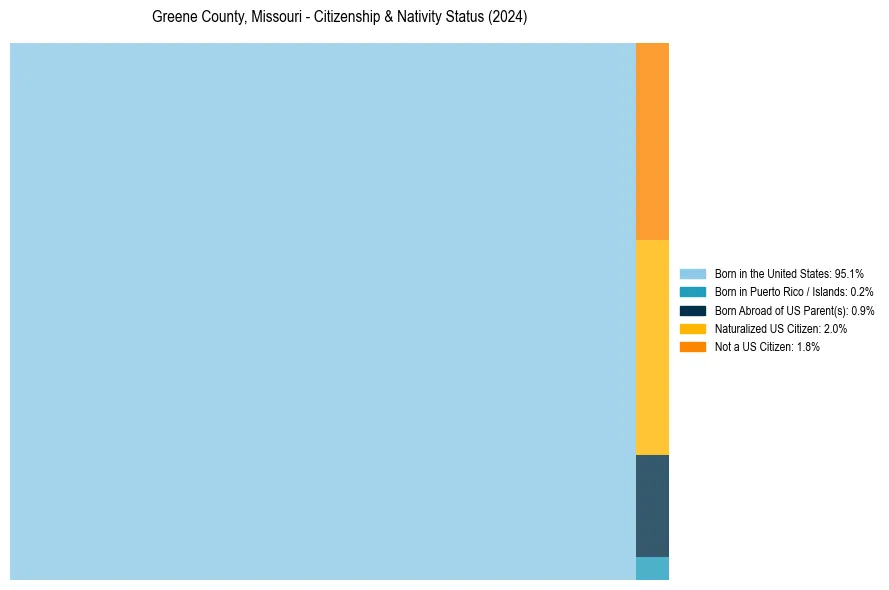
Greene County, Missouri Nativity & Citizenship Distribution
Greene County, Missouri Historical Nativity Trends (2010–2024)
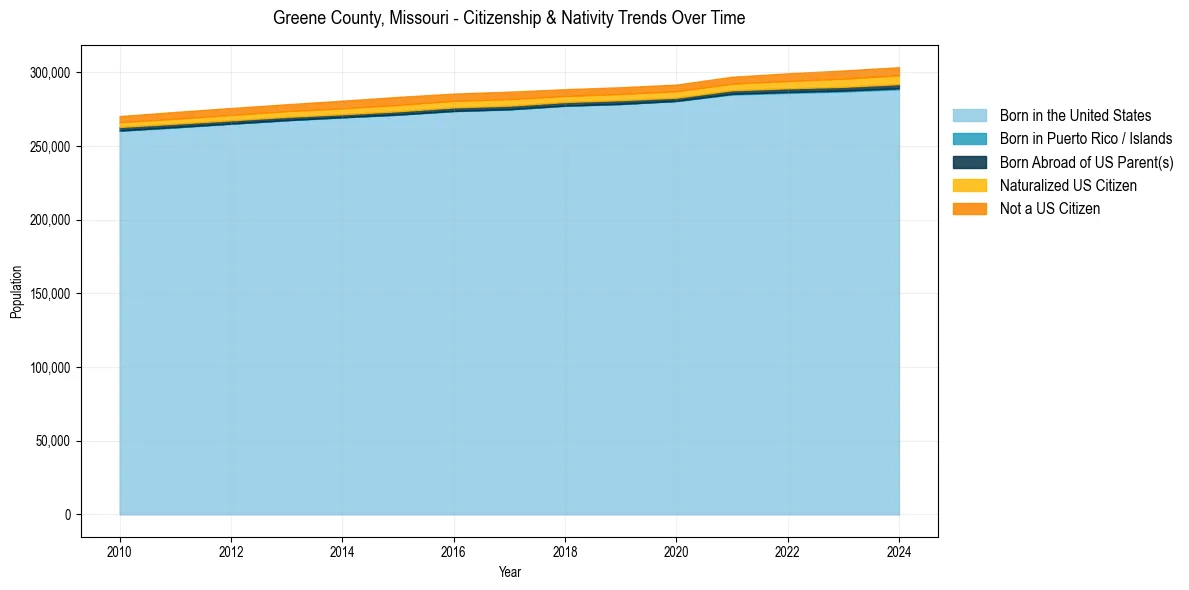
Greene County, Missouri Population & Nativity History
| Year | Total Pop | Foreign Born | Native Born |
|---|---|---|---|
| 2024 | 303,375 | 3.8% | 96.2% |
| 2023 | 301,121 | 3.7% | 96.3% |
| 2022 | 299,188 | 3.4% | 96.6% |
| 2021 | 296,875 | 3.1% | 96.9% |
| 2020 | 291,574 | 3.1% | 96.9% |
| 2019 | 289,756 | 3.0% | 97.0% |
| 2018 | 288,429 | 3.0% | 97.0% |
| 2017 | 286,759 | 3.3% | 96.7% |
| 2016 | 285,449 | 3.3% | 96.7% |
| 2015 | 283,206 | 3.4% | 96.6% |
| 2014 | 280,657 | 3.3% | 96.7% |
| 2013 | 278,231 | 3.1% | 96.9% |
| 2012 | 275,671 | 3.0% | 97.0% |
| 2011 | 273,020 | 2.9% | 97.1% |
| 2010 | 270,190 | 2.7% | 97.3% |
Nativity & Citizenship FAQs for Greene County, Missouri
Approximately 3.8% of residents in Greene County, Missouri were born outside the United States.
The vast majority of residents, roughly 98.2%, are U.S. citizens (including both native-born and naturalized citizens).