Wright County, Minnesota Nativity & Citizenship Status (2024)
Place of birth and citizenship status analysis for Wright County, Minnesota
Wright County, Minnesota Nativity & Citizenship Indicators (2024)
Native Born
95.5%
Foreign Born
4.5%
Naturalized
2.7%
US Citizens
98.3%
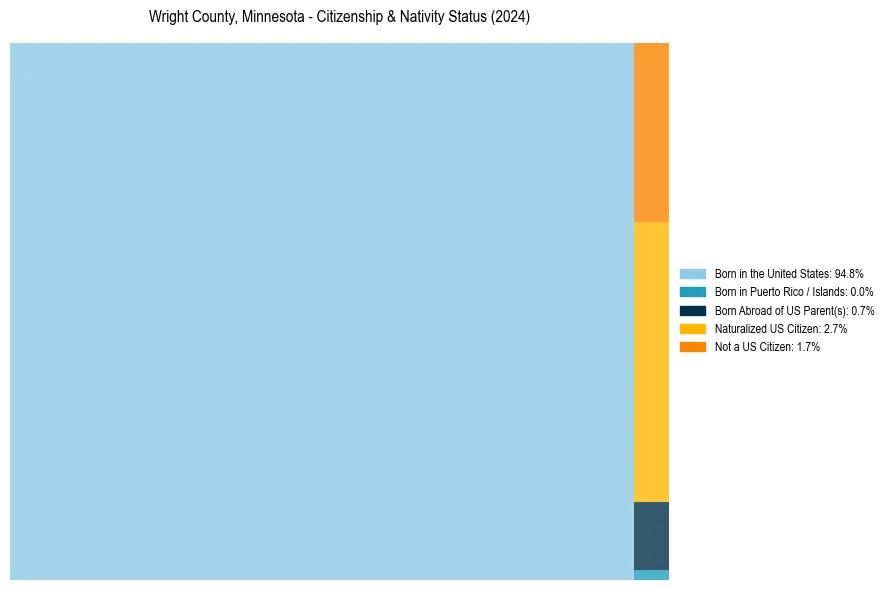
Wright County, Minnesota Nativity & Citizenship Distribution
Wright County, Minnesota Historical Nativity Trends (2010–2024)
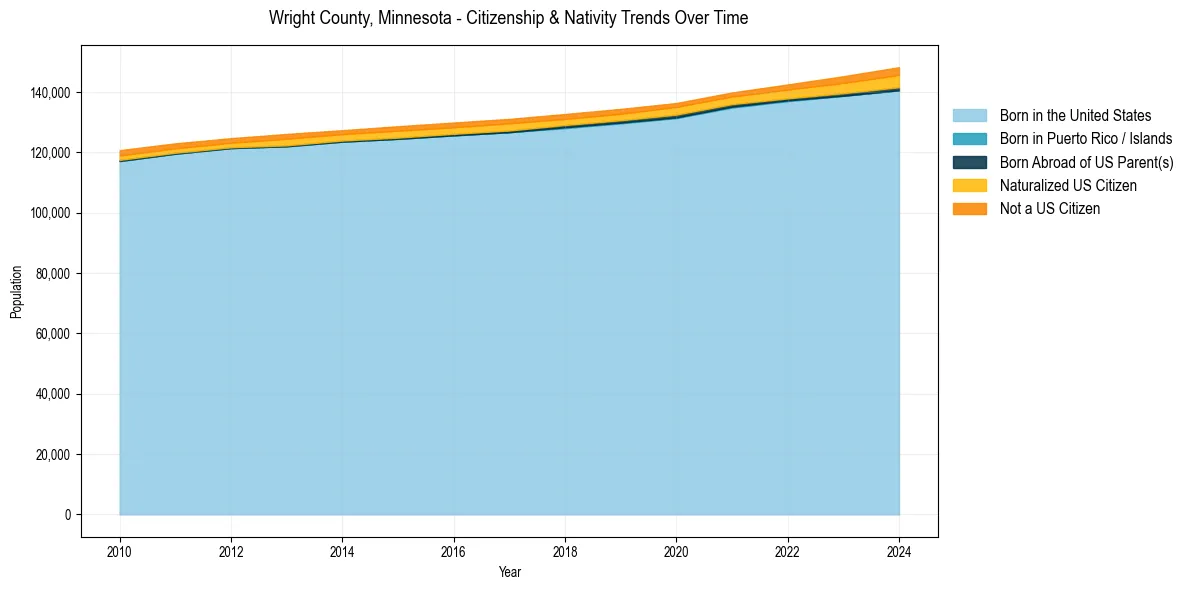
Wright County, Minnesota Population & Nativity History
| Year | Total Pop | Foreign Born | Native Born |
|---|---|---|---|
| 2024 | 148,269 | 4.5% | 95.5% |
| 2023 | 145,270 | 3.9% | 96.1% |
| 2022 | 142,543 | 3.2% | 96.8% |
| 2021 | 139,890 | 2.8% | 97.2% |
| 2020 | 136,387 | 2.8% | 97.2% |
| 2019 | 134,438 | 2.8% | 97.2% |
| 2018 | 132,745 | 2.8% | 97.2% |
| 2017 | 131,130 | 2.9% | 97.1% |
| 2016 | 129,922 | 2.9% | 97.1% |
| 2015 | 128,691 | 2.9% | 97.1% |
| 2014 | 127,386 | 2.7% | 97.3% |
| 2013 | 126,142 | 3.0% | 97.0% |
| 2012 | 124,737 | 2.4% | 97.6% |
| 2011 | 123,019 | 2.5% | 97.5% |
| 2010 | 120,764 | 2.7% | 97.3% |
Nativity & Citizenship FAQs for Wright County, Minnesota
Approximately 4.5% of residents in Wright County, Minnesota were born outside the United States.
The vast majority of residents, roughly 98.3%, are U.S. citizens (including both native-born and naturalized citizens).