Washington County, Minnesota Nativity & Citizenship Status (2024)
Place of birth and citizenship status analysis for Washington County, Minnesota
Washington County, Minnesota Nativity & Citizenship Indicators (2024)
Native Born
91.5%
Foreign Born
8.5%
Naturalized
5.8%
US Citizens
97.2%
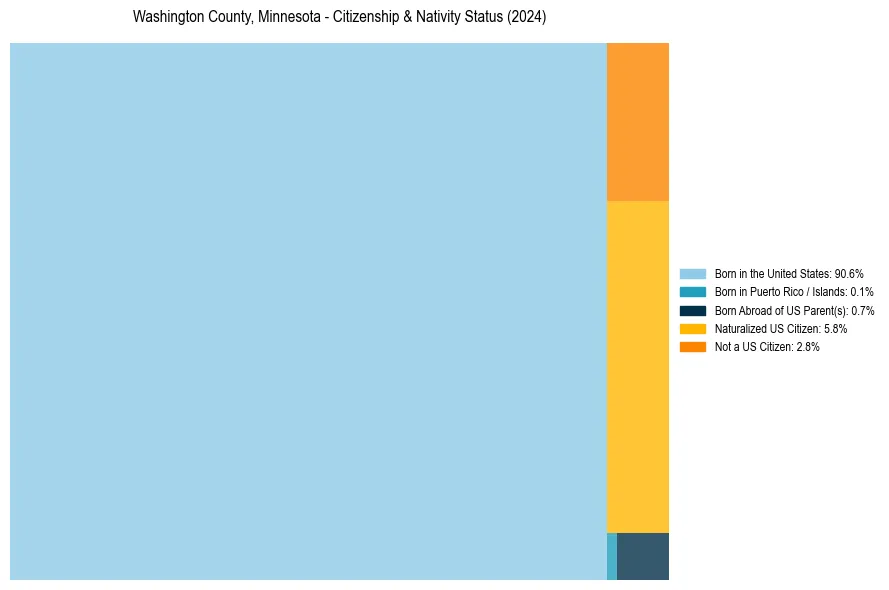
Washington County, Minnesota Nativity & Citizenship Distribution
Washington County, Minnesota Historical Nativity Trends (2010–2024)
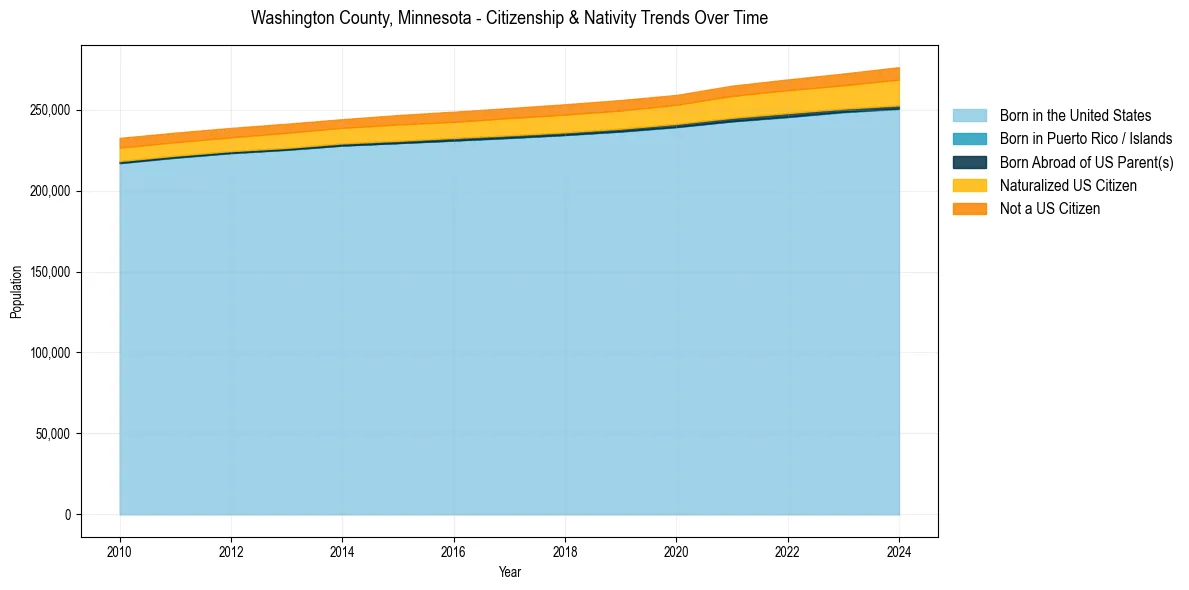
Washington County, Minnesota Population & Nativity History
| Year | Total Pop | Foreign Born | Native Born |
|---|---|---|---|
| 2024 | 276,238 | 8.5% | 91.5% |
| 2023 | 272,298 | 8.0% | 92.0% |
| 2022 | 268,651 | 7.7% | 92.3% |
| 2021 | 264,818 | 7.5% | 92.5% |
| 2020 | 259,072 | 6.9% | 93.1% |
| 2019 | 255,938 | 6.9% | 93.1% |
| 2018 | 253,317 | 6.8% | 93.2% |
| 2017 | 250,979 | 6.7% | 93.3% |
| 2016 | 248,745 | 6.5% | 93.5% |
| 2015 | 246,670 | 6.5% | 93.5% |
| 2014 | 244,103 | 6.1% | 93.9% |
| 2013 | 241,315 | 6.2% | 93.8% |
| 2012 | 238,721 | 6.0% | 94.0% |
| 2011 | 235,802 | 6.0% | 94.0% |
| 2010 | 232,536 | 6.1% | 93.9% |
Nativity & Citizenship FAQs for Washington County, Minnesota
Approximately 8.5% of residents in Washington County, Minnesota were born outside the United States.
The vast majority of residents, roughly 97.2%, are U.S. citizens (including both native-born and naturalized citizens).