Olmsted County, Minnesota Nativity & Citizenship Status (2024)
Place of birth and citizenship status analysis for Olmsted County, Minnesota
Olmsted County, Minnesota Nativity & Citizenship Indicators (2024)
Native Born
89.0%
Foreign Born
11.0%
Naturalized
6.8%
US Citizens
95.8%
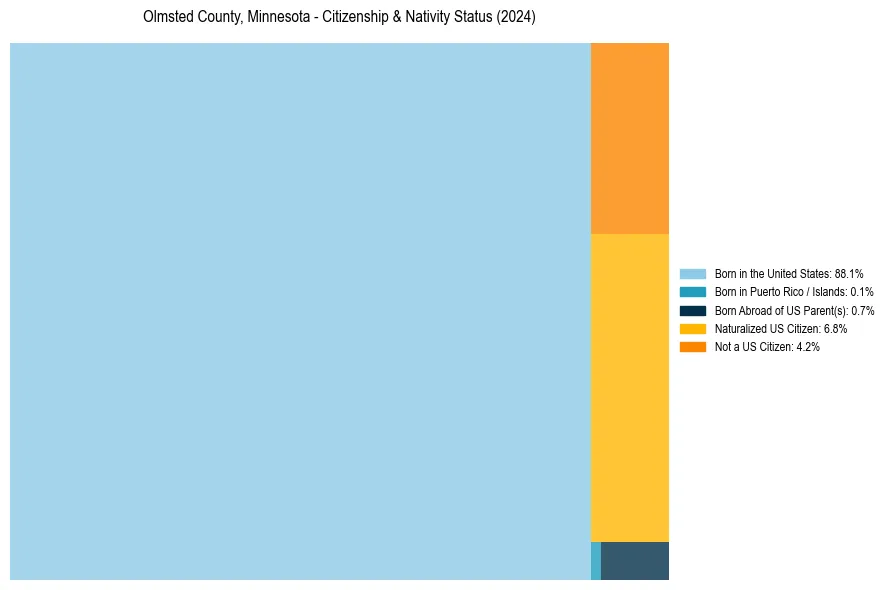
Olmsted County, Minnesota Nativity & Citizenship Distribution
Olmsted County, Minnesota Historical Nativity Trends (2010–2024)
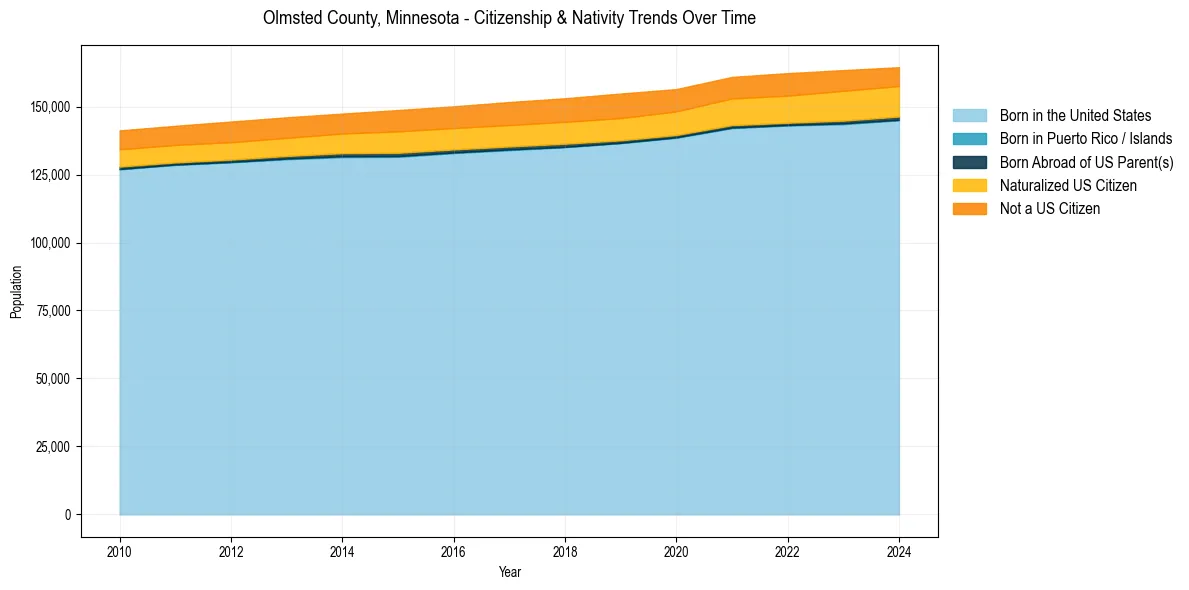
Olmsted County, Minnesota Population & Nativity History
| Year | Total Pop | Foreign Born | Native Born |
|---|---|---|---|
| 2024 | 164,498 | 11.0% | 89.0% |
| 2023 | 163,425 | 11.4% | 88.6% |
| 2022 | 162,307 | 11.2% | 88.8% |
| 2021 | 160,928 | 11.0% | 89.0% |
| 2020 | 156,446 | 10.8% | 89.2% |
| 2019 | 154,809 | 11.1% | 88.9% |
| 2018 | 153,065 | 10.9% | 89.1% |
| 2017 | 151,685 | 10.8% | 89.2% |
| 2016 | 150,104 | 10.6% | 89.4% |
| 2015 | 148,736 | 10.6% | 89.4% |
| 2014 | 147,431 | 9.9% | 90.1% |
| 2013 | 146,063 | 9.7% | 90.3% |
| 2012 | 144,507 | 9.7% | 90.3% |
| 2011 | 142,934 | 9.4% | 90.6% |
| 2010 | 141,244 | 9.4% | 90.6% |
Nativity & Citizenship FAQs for Olmsted County, Minnesota
Approximately 11.0% of residents in Olmsted County, Minnesota were born outside the United States.
The vast majority of residents, roughly 95.8%, are U.S. citizens (including both native-born and naturalized citizens).