Hennepin County, Minnesota Nativity & Citizenship Status (2024)
Place of birth and citizenship status analysis for Hennepin County, Minnesota
Hennepin County, Minnesota Nativity & Citizenship Indicators (2024)
Native Born
86.4%
Foreign Born
13.6%
Naturalized
7.9%
US Citizens
94.3%
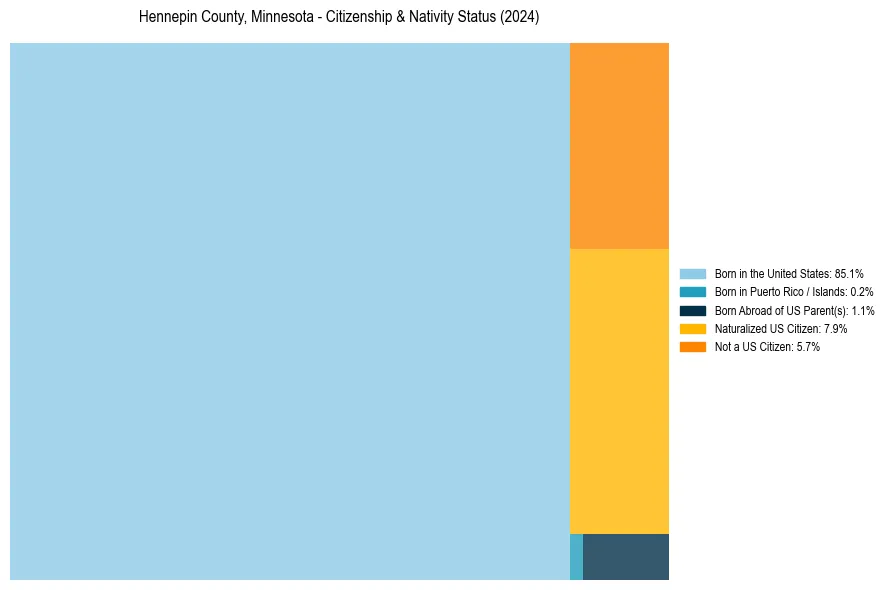
Hennepin County, Minnesota Nativity & Citizenship Distribution
Hennepin County, Minnesota Historical Nativity Trends (2010–2024)
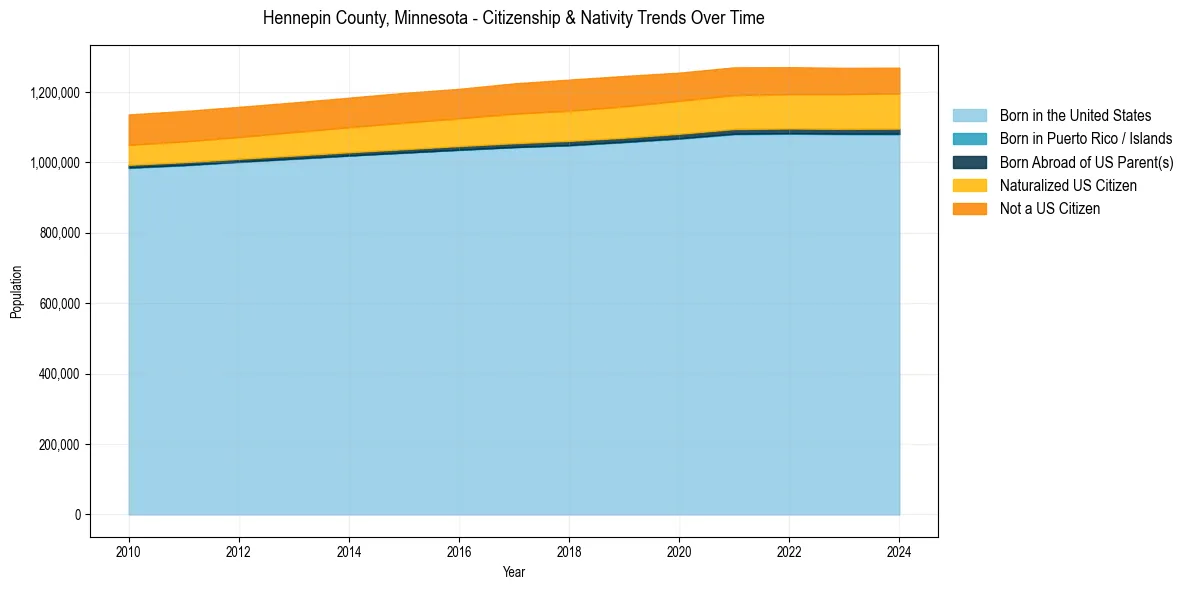
Hennepin County, Minnesota Population & Nativity History
| Year | Total Pop | Foreign Born | Native Born |
|---|---|---|---|
| 2024 | 1,269,496 | 13.6% | 86.4% |
| 2023 | 1,268,903 | 13.7% | 86.3% |
| 2022 | 1,270,787 | 13.7% | 86.3% |
| 2021 | 1,270,283 | 13.8% | 86.2% |
| 2020 | 1,255,296 | 13.8% | 86.2% |
| 2019 | 1,245,837 | 14.1% | 85.9% |
| 2018 | 1,235,478 | 14.1% | 85.9% |
| 2017 | 1,224,763 | 13.9% | 86.1% |
| 2016 | 1,209,265 | 13.4% | 86.6% |
| 2015 | 1,197,776 | 13.4% | 86.6% |
| 2014 | 1,184,091 | 13.1% | 86.9% |
| 2013 | 1,170,623 | 12.9% | 87.1% |
| 2012 | 1,158,039 | 12.7% | 87.3% |
| 2011 | 1,146,195 | 12.7% | 87.3% |
| 2010 | 1,136,522 | 12.6% | 87.4% |
Nativity & Citizenship FAQs for Hennepin County, Minnesota
Approximately 13.6% of residents in Hennepin County, Minnesota were born outside the United States.
The vast majority of residents, roughly 94.3%, are U.S. citizens (including both native-born and naturalized citizens).