Wayne County, Michigan Nativity & Citizenship Status (2024)
Place of birth and citizenship status analysis for Wayne County, Michigan
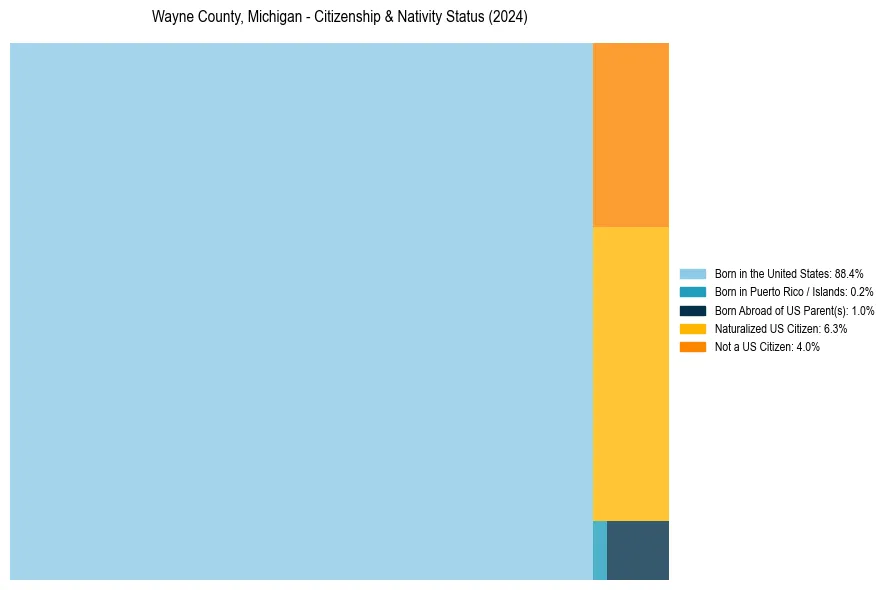
Wayne County, Michigan Nativity & Citizenship Indicators (2024)
Native Born
89.7%
Foreign Born
10.3%
Naturalized
6.3%
US Citizens
96.0%
Wayne County, Michigan Nativity & Citizenship Distribution
Wayne County, Michigan Historical Nativity Trends (2010–2024)
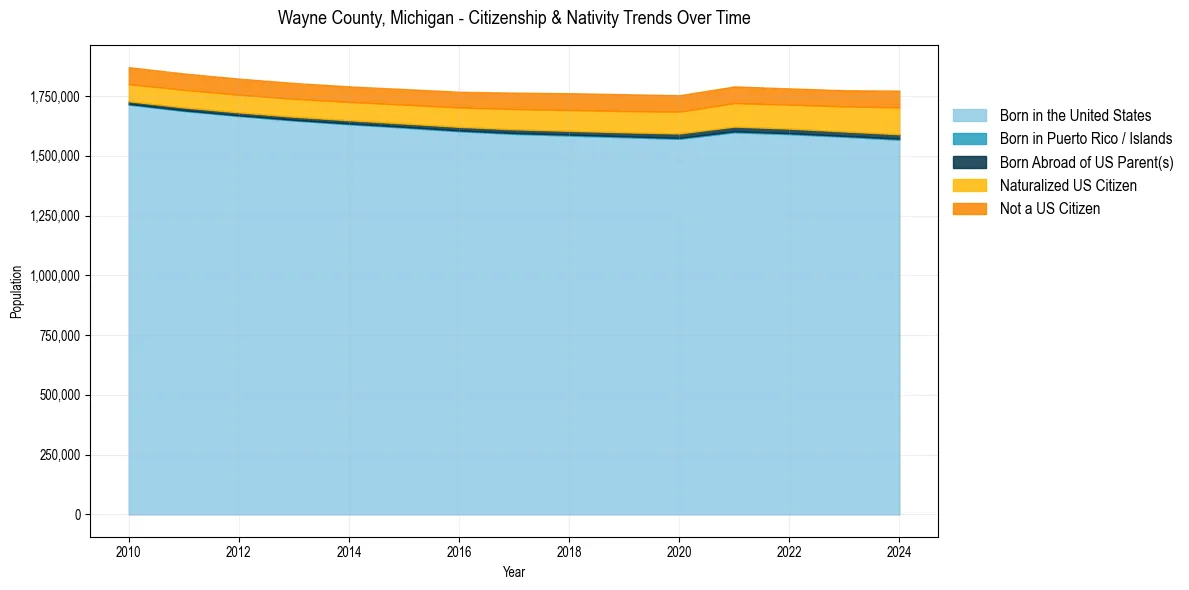
Wayne County, Michigan Population & Nativity History
| Year | Total Pop | Foreign Born | Native Born |
|---|---|---|---|
| 2024 | 1,772,259 | 10.3% | 89.7% |
| 2023 | 1,773,767 | 9.7% | 90.3% |
| 2022 | 1,781,641 | 9.4% | 90.6% |
| 2021 | 1,789,781 | 9.4% | 90.6% |
| 2020 | 1,753,059 | 9.1% | 90.9% |
| 2019 | 1,757,299 | 9.1% | 90.9% |
| 2018 | 1,761,382 | 8.9% | 91.1% |
| 2017 | 1,763,822 | 8.7% | 91.3% |
| 2016 | 1,767,593 | 8.3% | 91.7% |
| 2015 | 1,778,969 | 8.1% | 91.9% |
| 2014 | 1,790,078 | 7.9% | 92.1% |
| 2013 | 1,804,507 | 7.8% | 92.2% |
| 2012 | 1,822,469 | 7.7% | 92.3% |
| 2011 | 1,844,186 | 7.7% | 92.3% |
| 2010 | 1,870,362 | 7.6% | 92.4% |
Nativity & Citizenship FAQs for Wayne County, Michigan
Approximately 10.3% of residents in Wayne County, Michigan were born outside the United States.
The vast majority of residents, roughly 96.0%, are U.S. citizens (including both native-born and naturalized citizens).