Tuscola County, Michigan Nativity & Citizenship Status (2024)
Place of birth and citizenship status analysis for Tuscola County, Michigan
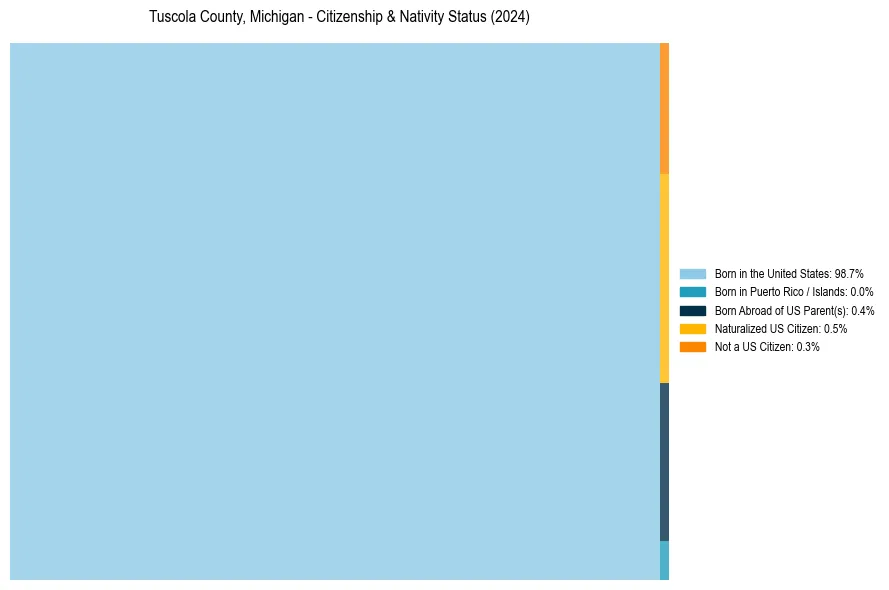
Tuscola County, Michigan Nativity & Citizenship Indicators (2024)
Native Born
99.1%
Foreign Born
0.9%
Naturalized
0.5%
US Citizens
99.7%
Tuscola County, Michigan Nativity & Citizenship Distribution
Tuscola County, Michigan Historical Nativity Trends (2010–2024)
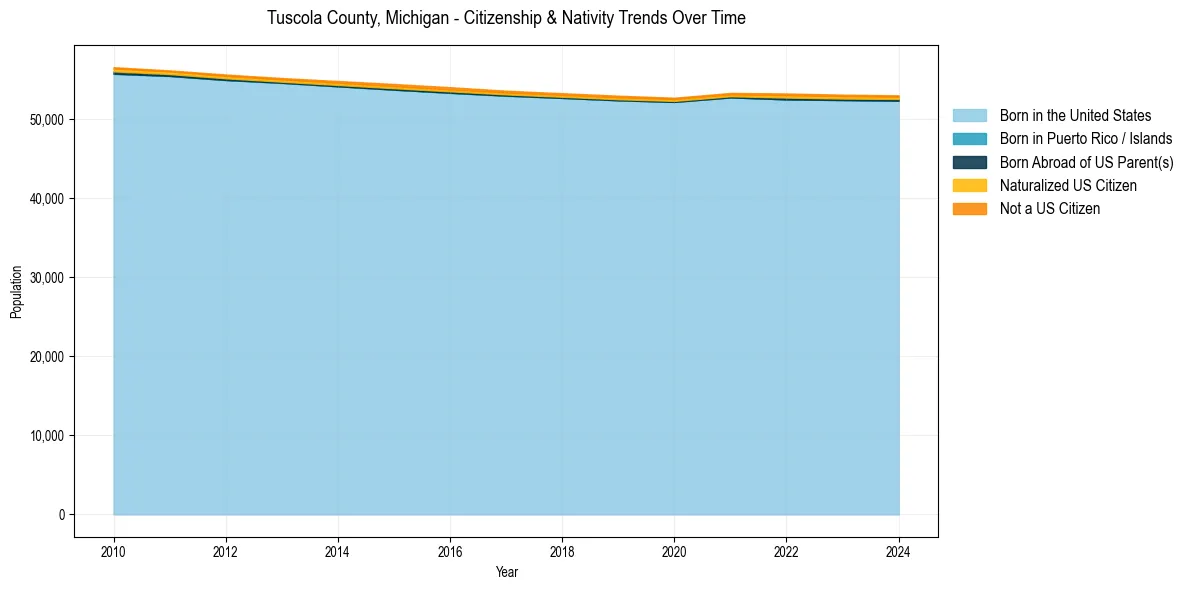
Tuscola County, Michigan Population & Nativity History
| Year | Total Pop | Foreign Born | Native Born |
|---|---|---|---|
| 2024 | 52,980 | 0.9% | 99.1% |
| 2023 | 53,071 | 0.9% | 99.1% |
| 2022 | 53,218 | 1.0% | 99.0% |
| 2021 | 53,288 | 0.8% | 99.2% |
| 2020 | 52,683 | 0.8% | 99.2% |
| 2019 | 52,939 | 0.9% | 99.1% |
| 2018 | 53,250 | 0.8% | 99.2% |
| 2017 | 53,569 | 0.9% | 99.1% |
| 2016 | 54,014 | 1.0% | 99.0% |
| 2015 | 54,420 | 1.0% | 99.0% |
| 2014 | 54,795 | 0.9% | 99.1% |
| 2013 | 55,172 | 0.8% | 99.2% |
| 2012 | 55,616 | 0.9% | 99.1% |
| 2011 | 56,134 | 0.8% | 99.2% |
| 2010 | 56,543 | 0.9% | 99.1% |
Nativity & Citizenship FAQs for Tuscola County, Michigan
Approximately 0.9% of residents in Tuscola County, Michigan were born outside the United States.
The vast majority of residents, roughly 99.7%, are U.S. citizens (including both native-born and naturalized citizens).