St. Clair County, Michigan Nativity & Citizenship Status (2024)
Place of birth and citizenship status analysis for St. Clair County, Michigan
St. Clair County, Michigan Nativity & Citizenship Indicators (2024)
Native Born
98.0%
Foreign Born
2.0%
Naturalized
1.2%
US Citizens
99.2%
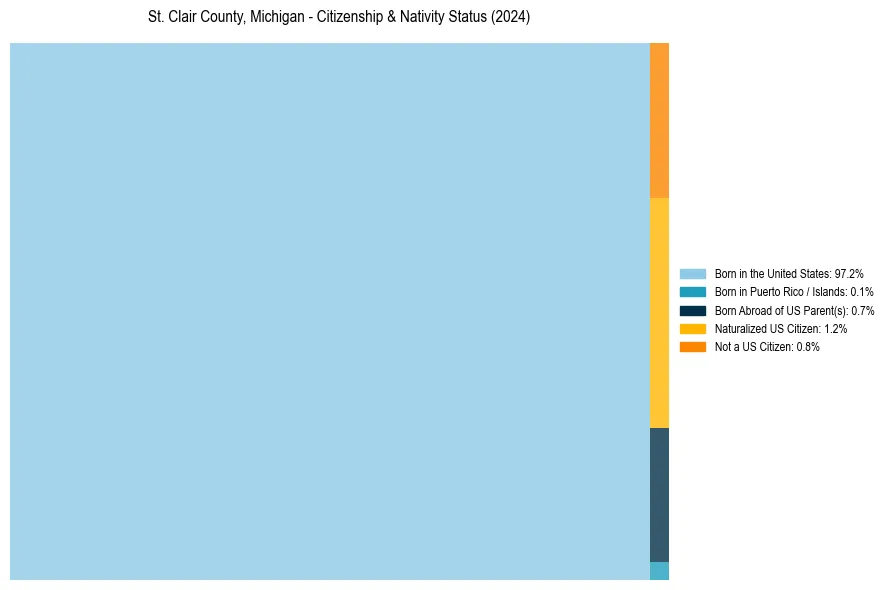
St. Clair County, Michigan Nativity & Citizenship Distribution
St. Clair County, Michigan Historical Nativity Trends (2010–2024)
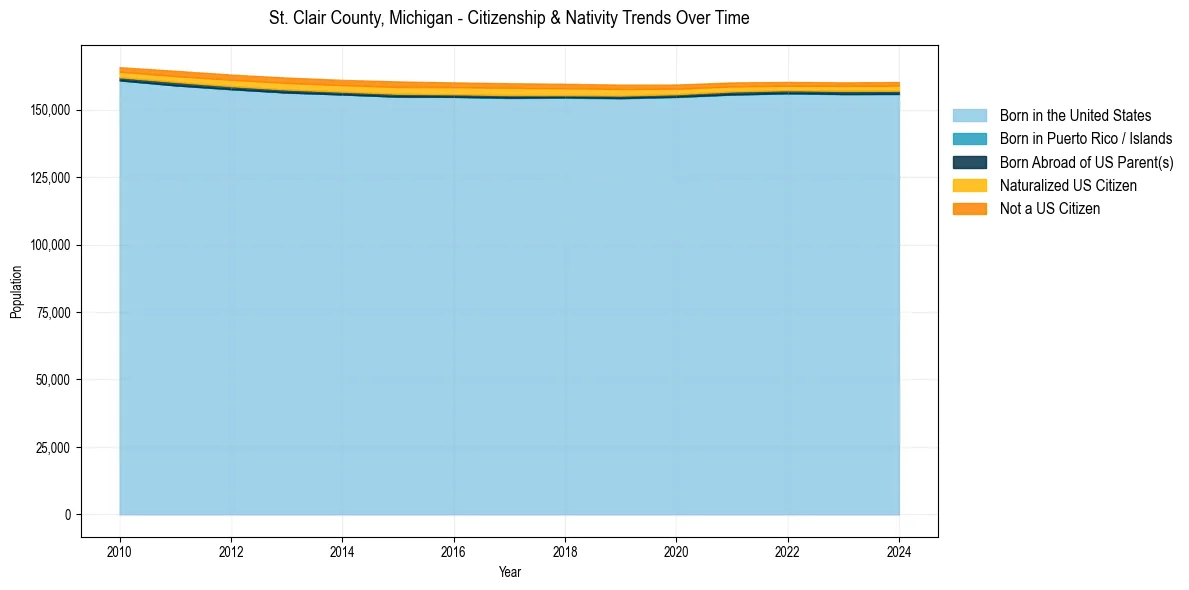
St. Clair County, Michigan Population & Nativity History
| Year | Total Pop | Foreign Born | Native Born |
|---|---|---|---|
| 2024 | 160,221 | 2.0% | 98.0% |
| 2023 | 160,089 | 2.0% | 98.0% |
| 2022 | 160,257 | 1.9% | 98.1% |
| 2021 | 160,067 | 2.1% | 97.9% |
| 2020 | 159,285 | 2.2% | 97.8% |
| 2019 | 159,247 | 2.5% | 97.5% |
| 2018 | 159,566 | 2.7% | 97.3% |
| 2017 | 159,761 | 2.8% | 97.2% |
| 2016 | 160,069 | 2.7% | 97.3% |
| 2015 | 160,429 | 2.8% | 97.2% |
| 2014 | 161,008 | 2.7% | 97.3% |
| 2013 | 161,865 | 2.7% | 97.3% |
| 2012 | 162,978 | 2.6% | 97.4% |
| 2011 | 164,374 | 2.5% | 97.5% |
| 2010 | 165,719 | 2.3% | 97.7% |
Nativity & Citizenship FAQs for St. Clair County, Michigan
Approximately 2.0% of residents in St. Clair County, Michigan were born outside the United States.
The vast majority of residents, roughly 99.2%, are U.S. citizens (including both native-born and naturalized citizens).