Shiawassee County, Michigan Nativity & Citizenship Status (2024)
Place of birth and citizenship status analysis for Shiawassee County, Michigan
Shiawassee County, Michigan Nativity & Citizenship Indicators (2024)
Native Born
98.9%
Foreign Born
1.1%
Naturalized
0.8%
US Citizens
99.6%
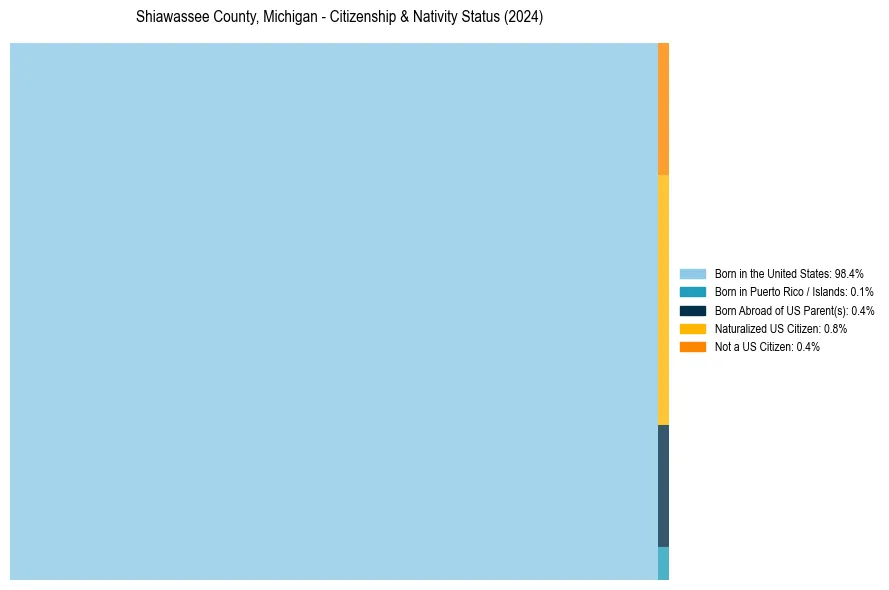
Shiawassee County, Michigan Nativity & Citizenship Distribution
Shiawassee County, Michigan Historical Nativity Trends (2010–2024)
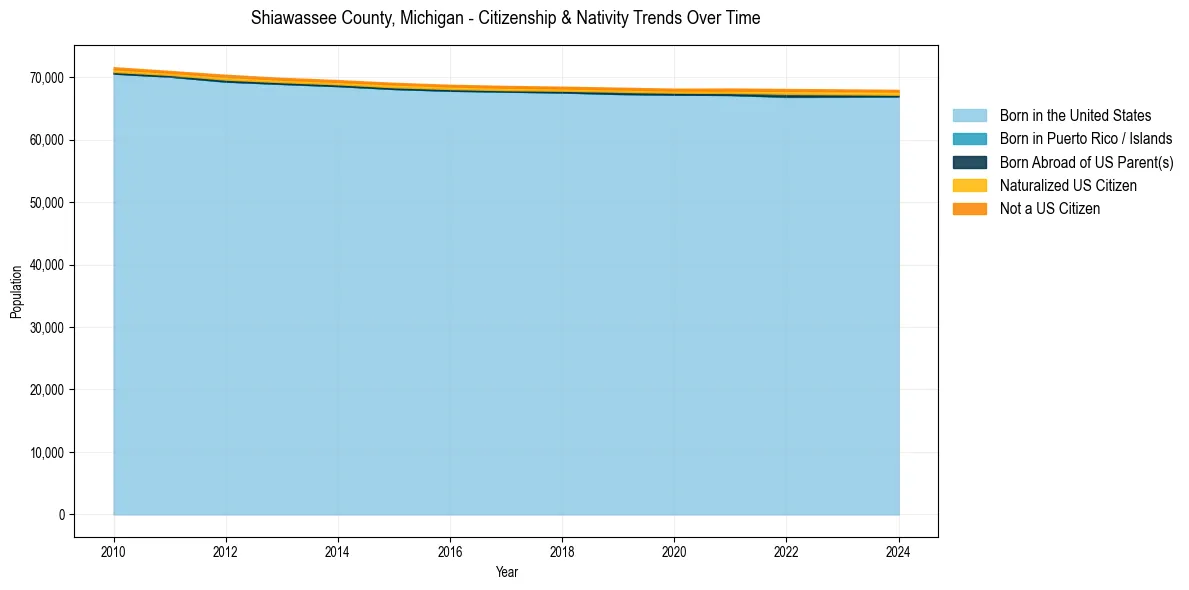
Shiawassee County, Michigan Population & Nativity History
| Year | Total Pop | Foreign Born | Native Born |
|---|---|---|---|
| 2024 | 67,991 | 1.1% | 98.9% |
| 2023 | 68,061 | 1.1% | 98.9% |
| 2022 | 68,124 | 1.1% | 98.9% |
| 2021 | 68,203 | 1.0% | 99.0% |
| 2020 | 68,176 | 0.9% | 99.1% |
| 2019 | 68,340 | 0.9% | 99.1% |
| 2018 | 68,493 | 0.9% | 99.1% |
| 2017 | 68,617 | 1.0% | 99.0% |
| 2016 | 68,800 | 1.0% | 99.0% |
| 2015 | 69,113 | 1.0% | 99.0% |
| 2014 | 69,553 | 1.0% | 99.0% |
| 2013 | 69,910 | 1.0% | 99.0% |
| 2012 | 70,402 | 1.1% | 98.9% |
| 2011 | 71,016 | 0.9% | 99.1% |
| 2010 | 71,621 | 1.1% | 98.9% |
Nativity & Citizenship FAQs for Shiawassee County, Michigan
Approximately 1.1% of residents in Shiawassee County, Michigan were born outside the United States.
The vast majority of residents, roughly 99.6%, are U.S. citizens (including both native-born and naturalized citizens).