Saginaw County, Michigan Nativity & Citizenship Status (2024)
Place of birth and citizenship status analysis for Saginaw County, Michigan
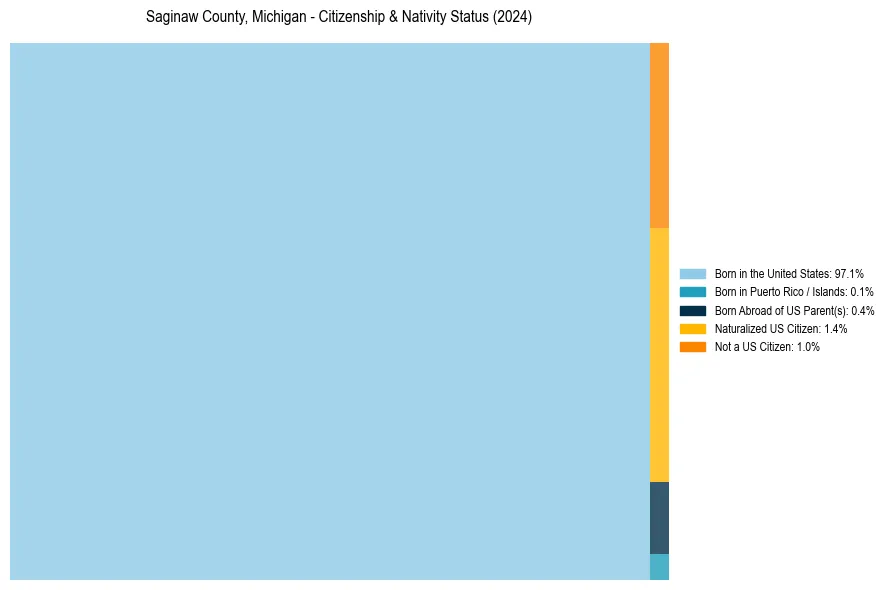
Saginaw County, Michigan Nativity & Citizenship Indicators (2024)
Native Born
97.6%
Foreign Born
2.4%
Naturalized
1.4%
US Citizens
99.0%
Saginaw County, Michigan Nativity & Citizenship Distribution
Saginaw County, Michigan Historical Nativity Trends (2010–2024)
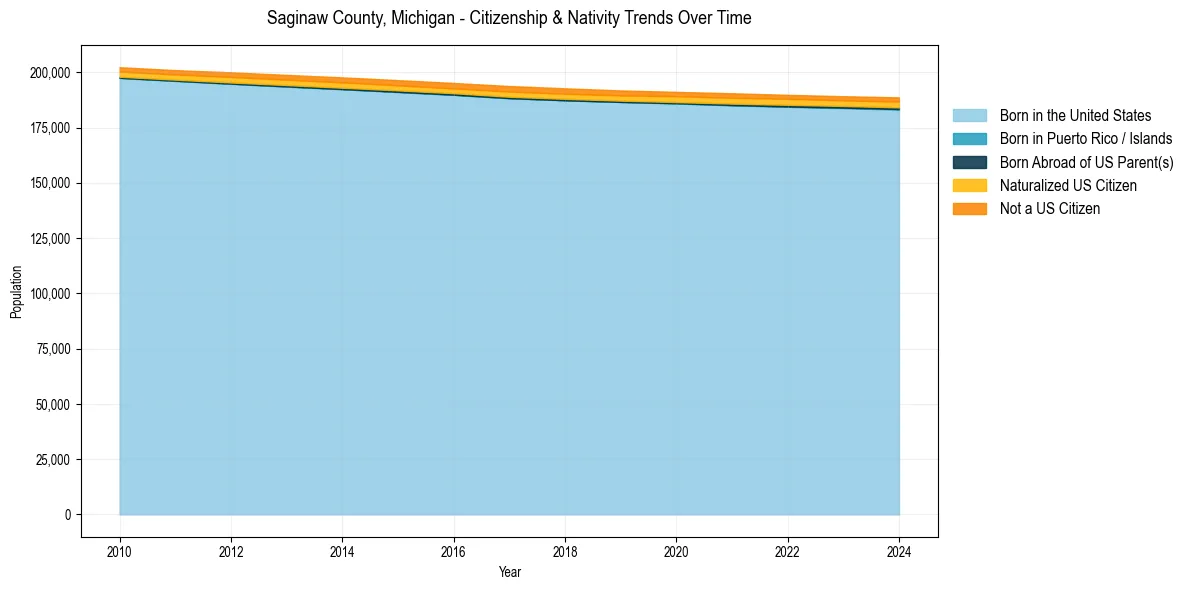
Saginaw County, Michigan Population & Nativity History
| Year | Total Pop | Foreign Born | Native Born |
|---|---|---|---|
| 2024 | 188,665 | 2.4% | 97.6% |
| 2023 | 189,210 | 2.3% | 97.7% |
| 2022 | 189,821 | 2.4% | 97.6% |
| 2021 | 190,540 | 2.5% | 97.5% |
| 2020 | 191,166 | 2.4% | 97.6% |
| 2019 | 191,821 | 2.4% | 97.6% |
| 2018 | 192,778 | 2.5% | 97.5% |
| 2017 | 193,803 | 2.5% | 97.5% |
| 2016 | 195,201 | 2.4% | 97.6% |
| 2015 | 196,479 | 2.4% | 97.6% |
| 2014 | 197,727 | 2.4% | 97.6% |
| 2013 | 198,841 | 2.3% | 97.7% |
| 2012 | 200,017 | 2.3% | 97.7% |
| 2011 | 200,998 | 2.1% | 97.9% |
| 2010 | 202,336 | 2.1% | 97.9% |
Nativity & Citizenship FAQs for Saginaw County, Michigan
Approximately 2.4% of residents in Saginaw County, Michigan were born outside the United States.
The vast majority of residents, roughly 99.0%, are U.S. citizens (including both native-born and naturalized citizens).