Ottawa County, Michigan Nativity & Citizenship Status (2024)
Place of birth and citizenship status analysis for Ottawa County, Michigan
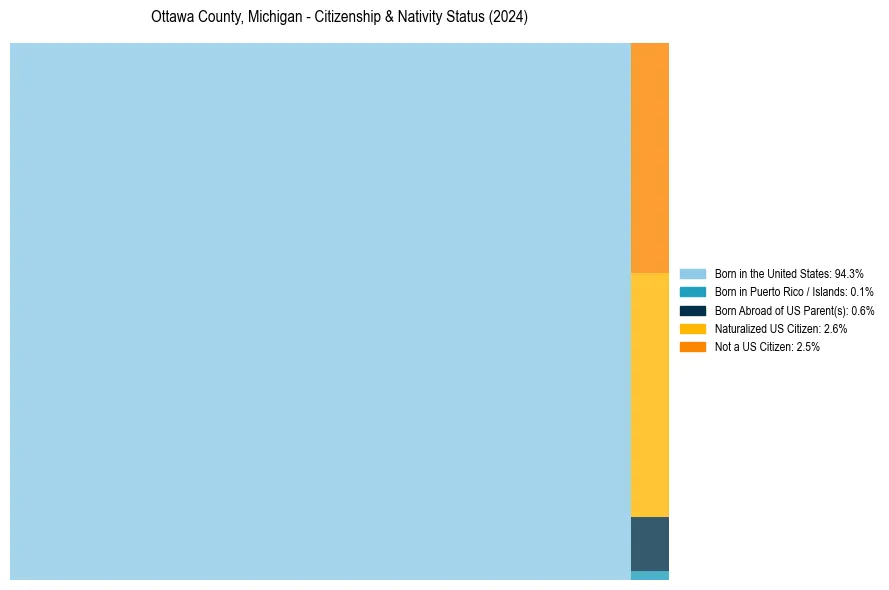
Ottawa County, Michigan Nativity & Citizenship Indicators (2024)
Native Born
94.9%
Foreign Born
5.1%
Naturalized
2.6%
US Citizens
97.5%
Ottawa County, Michigan Nativity & Citizenship Distribution
Ottawa County, Michigan Historical Nativity Trends (2010–2024)
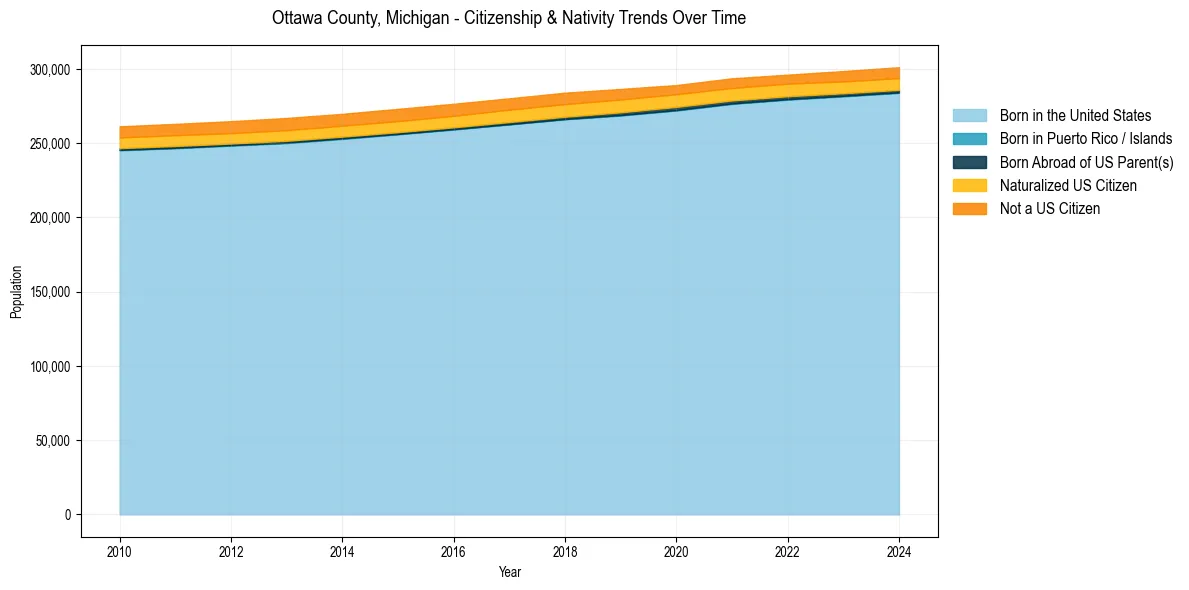
Ottawa County, Michigan Population & Nativity History
| Year | Total Pop | Foreign Born | Native Born |
|---|---|---|---|
| 2024 | 301,203 | 5.1% | 94.9% |
| 2023 | 298,614 | 5.0% | 95.0% |
| 2022 | 296,183 | 4.9% | 95.1% |
| 2021 | 293,713 | 5.1% | 94.9% |
| 2020 | 289,162 | 5.1% | 94.9% |
| 2019 | 286,558 | 5.5% | 94.5% |
| 2018 | 284,034 | 5.7% | 94.3% |
| 2017 | 280,243 | 5.7% | 94.3% |
| 2016 | 276,583 | 5.7% | 94.3% |
| 2015 | 273,136 | 5.7% | 94.3% |
| 2014 | 269,795 | 5.7% | 94.3% |
| 2013 | 267,017 | 5.8% | 94.2% |
| 2012 | 264,835 | 5.7% | 94.3% |
| 2011 | 263,037 | 5.7% | 94.3% |
| 2010 | 261,376 | 5.6% | 94.4% |
Nativity & Citizenship FAQs for Ottawa County, Michigan
Approximately 5.1% of residents in Ottawa County, Michigan were born outside the United States.
The vast majority of residents, roughly 97.5%, are U.S. citizens (including both native-born and naturalized citizens).