Oakland County, Michigan Nativity & Citizenship Status (2024)
Place of birth and citizenship status analysis for Oakland County, Michigan
Oakland County, Michigan Nativity & Citizenship Indicators (2024)
Native Born
86.7%
Foreign Born
13.3%
Naturalized
7.2%
US Citizens
93.9%
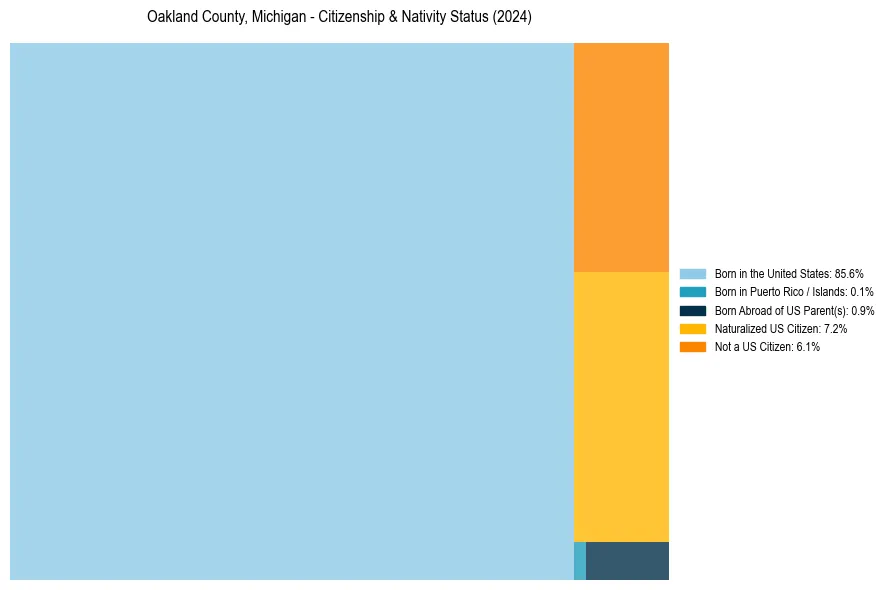
Oakland County, Michigan Nativity & Citizenship Distribution
Oakland County, Michigan Historical Nativity Trends (2010–2024)
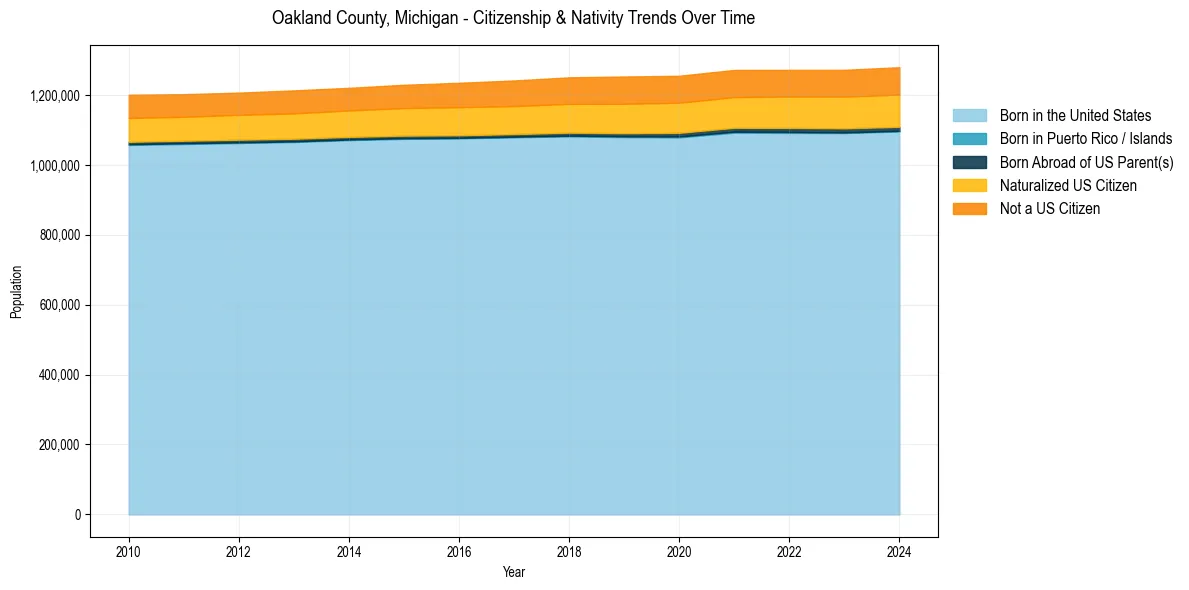
Oakland County, Michigan Population & Nativity History
| Year | Total Pop | Foreign Born | Native Born |
|---|---|---|---|
| 2024 | 1,279,825 | 13.3% | 86.7% |
| 2023 | 1,272,294 | 13.2% | 86.8% |
| 2022 | 1,272,264 | 13.1% | 86.9% |
| 2021 | 1,271,983 | 13.0% | 87.0% |
| 2020 | 1,255,340 | 13.0% | 87.0% |
| 2019 | 1,253,185 | 13.0% | 87.0% |
| 2018 | 1,250,843 | 12.7% | 87.3% |
| 2017 | 1,241,860 | 12.4% | 87.6% |
| 2016 | 1,235,215 | 12.2% | 87.8% |
| 2015 | 1,229,503 | 11.8% | 88.2% |
| 2014 | 1,220,798 | 11.5% | 88.5% |
| 2013 | 1,213,406 | 11.4% | 88.6% |
| 2012 | 1,207,097 | 11.2% | 88.8% |
| 2011 | 1,202,625 | 11.1% | 88.9% |
| 2010 | 1,201,113 | 11.2% | 88.8% |
Nativity & Citizenship FAQs for Oakland County, Michigan
Approximately 13.3% of residents in Oakland County, Michigan were born outside the United States.
The vast majority of residents, roughly 93.9%, are U.S. citizens (including both native-born and naturalized citizens).