Macomb County, Michigan Nativity & Citizenship Status (2024)
Place of birth and citizenship status analysis for Macomb County, Michigan
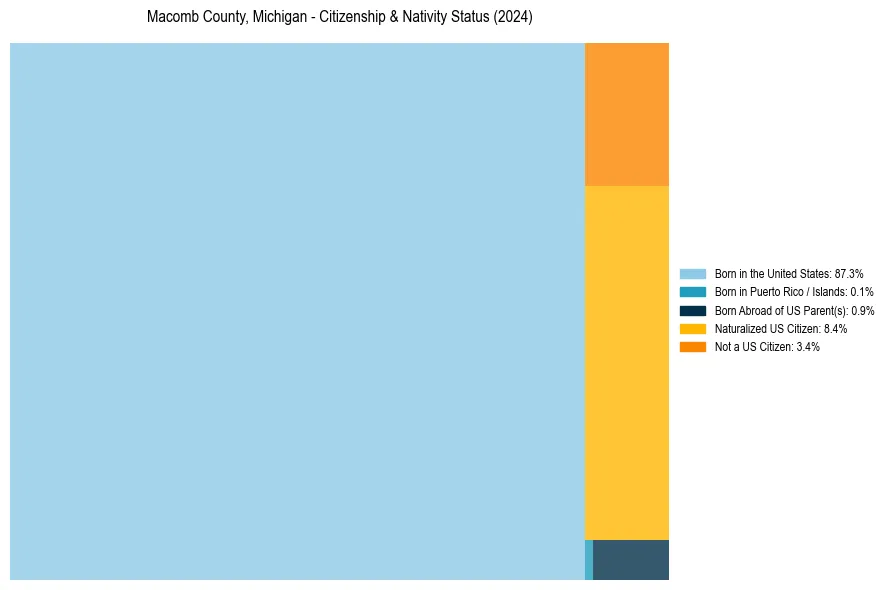
Macomb County, Michigan Nativity & Citizenship Indicators (2024)
Native Born
88.3%
Foreign Born
11.7%
Naturalized
8.4%
US Citizens
96.6%
Macomb County, Michigan Nativity & Citizenship Distribution
Macomb County, Michigan Historical Nativity Trends (2010–2024)
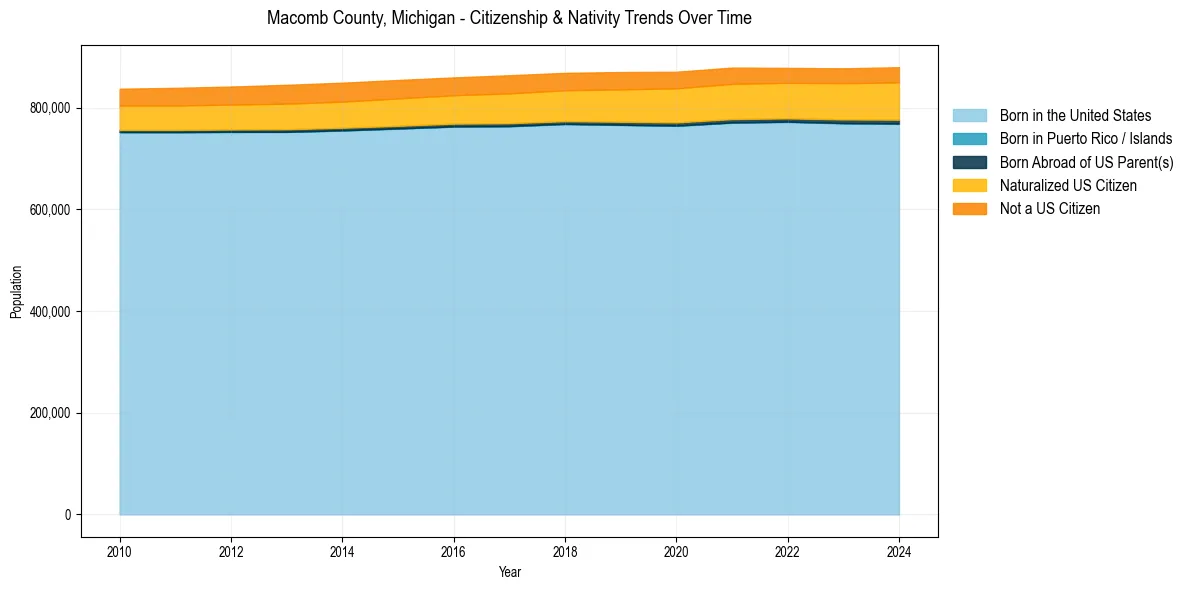
Macomb County, Michigan Population & Nativity History
| Year | Total Pop | Foreign Born | Native Born |
|---|---|---|---|
| 2024 | 879,853 | 11.7% | 88.3% |
| 2023 | 877,624 | 11.5% | 88.5% |
| 2022 | 878,453 | 11.3% | 88.7% |
| 2021 | 879,123 | 11.5% | 88.5% |
| 2020 | 870,893 | 11.5% | 88.5% |
| 2019 | 870,325 | 11.2% | 88.8% |
| 2018 | 868,704 | 10.9% | 89.1% |
| 2017 | 864,019 | 10.9% | 89.1% |
| 2016 | 859,703 | 10.6% | 89.4% |
| 2015 | 854,689 | 10.6% | 89.4% |
| 2014 | 849,344 | 10.4% | 89.6% |
| 2013 | 845,197 | 10.3% | 89.7% |
| 2012 | 841,769 | 10.0% | 90.0% |
| 2011 | 839,217 | 9.9% | 90.1% |
| 2010 | 837,490 | 9.7% | 90.3% |
Nativity & Citizenship FAQs for Macomb County, Michigan
Approximately 11.7% of residents in Macomb County, Michigan were born outside the United States.
The vast majority of residents, roughly 96.6%, are U.S. citizens (including both native-born and naturalized citizens).