Livingston County, Michigan Nativity & Citizenship Status (2024)
Place of birth and citizenship status analysis for Livingston County, Michigan
Livingston County, Michigan Nativity & Citizenship Indicators (2024)
Native Born
97.0%
Foreign Born
3.0%
Naturalized
2.1%
US Citizens
99.1%
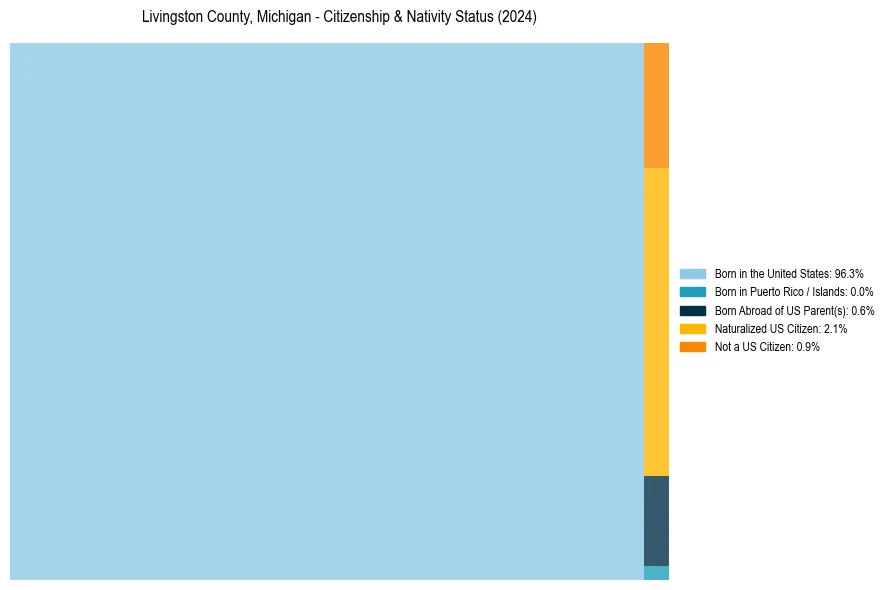
Livingston County, Michigan Nativity & Citizenship Distribution
Livingston County, Michigan Historical Nativity Trends (2010–2024)
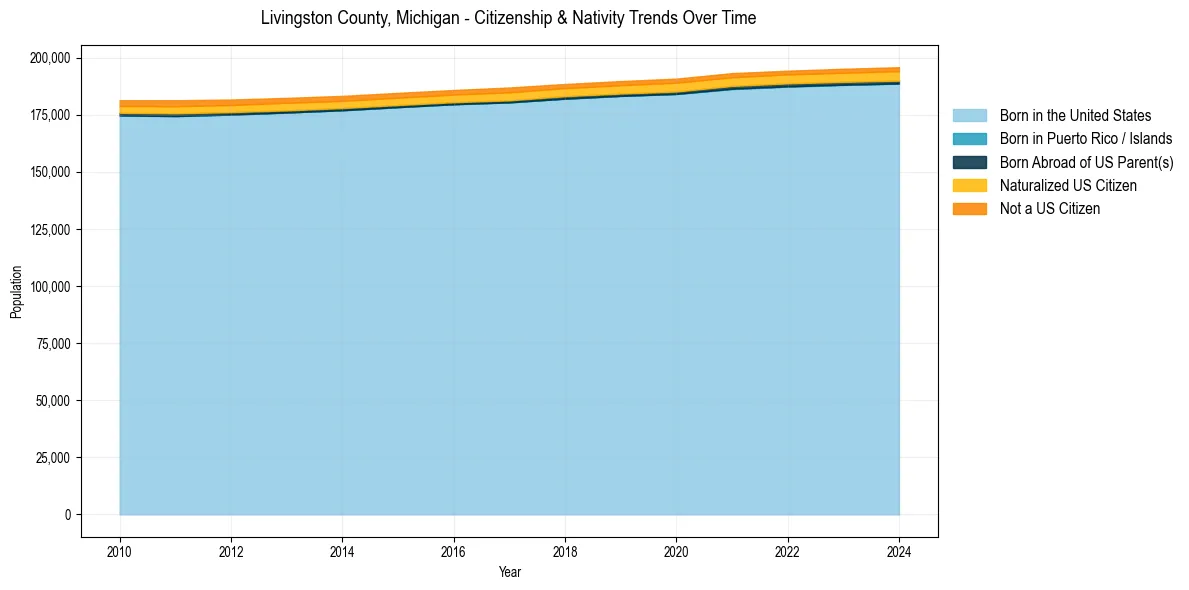
Livingston County, Michigan Population & Nativity History
| Year | Total Pop | Foreign Born | Native Born |
|---|---|---|---|
| 2024 | 195,833 | 3.0% | 97.0% |
| 2023 | 195,143 | 2.9% | 97.1% |
| 2022 | 194,302 | 2.9% | 97.1% |
| 2021 | 193,234 | 2.9% | 97.1% |
| 2020 | 190,832 | 3.0% | 97.0% |
| 2019 | 189,754 | 2.9% | 97.1% |
| 2018 | 188,482 | 2.8% | 97.2% |
| 2017 | 186,946 | 3.0% | 97.0% |
| 2016 | 185,841 | 2.9% | 97.1% |
| 2015 | 184,591 | 2.9% | 97.1% |
| 2014 | 183,264 | 2.9% | 97.1% |
| 2013 | 182,402 | 3.0% | 97.0% |
| 2012 | 181,678 | 3.0% | 97.0% |
| 2011 | 181,362 | 3.2% | 96.8% |
| 2010 | 181,350 | 3.0% | 97.0% |
Nativity & Citizenship FAQs for Livingston County, Michigan
Approximately 3.0% of residents in Livingston County, Michigan were born outside the United States.
The vast majority of residents, roughly 99.1%, are U.S. citizens (including both native-born and naturalized citizens).