Kent County, Michigan Nativity & Citizenship Status (2024)
Place of birth and citizenship status analysis for Kent County, Michigan
Kent County, Michigan Nativity & Citizenship Indicators (2024)
Native Born
91.1%
Foreign Born
8.9%
Naturalized
3.9%
US Citizens
95.0%
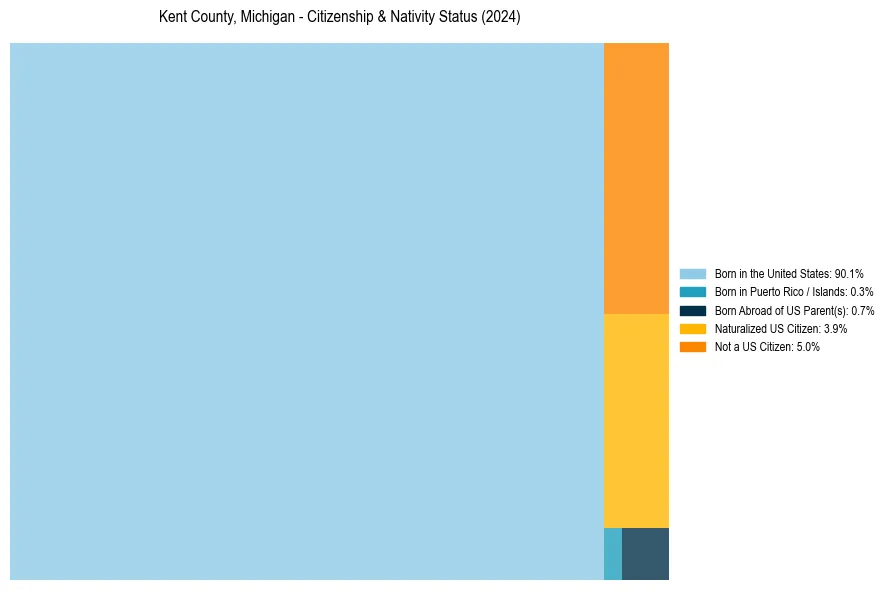
Kent County, Michigan Nativity & Citizenship Distribution
Kent County, Michigan Historical Nativity Trends (2010–2024)
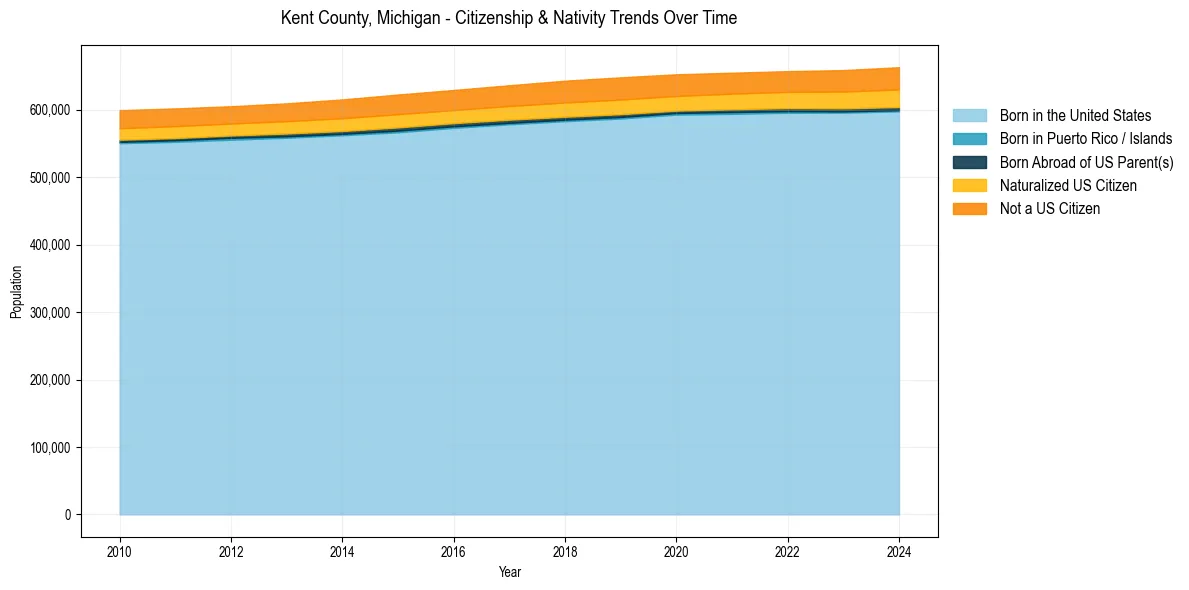
Kent County, Michigan Population & Nativity History
| Year | Total Pop | Foreign Born | Native Born |
|---|---|---|---|
| 2024 | 663,150 | 8.9% | 91.1% |
| 2023 | 658,844 | 8.6% | 91.4% |
| 2022 | 657,321 | 8.4% | 91.6% |
| 2021 | 654,958 | 8.3% | 91.7% |
| 2020 | 652,617 | 8.3% | 91.7% |
| 2019 | 648,121 | 8.4% | 91.6% |
| 2018 | 643,140 | 8.3% | 91.7% |
| 2017 | 636,376 | 8.0% | 92.0% |
| 2016 | 629,352 | 7.8% | 92.2% |
| 2015 | 622,590 | 7.8% | 92.2% |
| 2014 | 615,381 | 7.6% | 92.4% |
| 2013 | 609,544 | 7.4% | 92.6% |
| 2012 | 605,244 | 7.2% | 92.8% |
| 2011 | 602,046 | 7.3% | 92.7% |
| 2010 | 599,432 | 7.3% | 92.7% |
Nativity & Citizenship FAQs for Kent County, Michigan
Approximately 8.9% of residents in Kent County, Michigan were born outside the United States.
The vast majority of residents, roughly 95.0%, are U.S. citizens (including both native-born and naturalized citizens).