Kalamazoo County, Michigan Nativity & Citizenship Status (2024)
Place of birth and citizenship status analysis for Kalamazoo County, Michigan
Kalamazoo County, Michigan Nativity & Citizenship Indicators (2024)
Native Born
94.2%
Foreign Born
5.8%
Naturalized
2.8%
US Citizens
97.0%
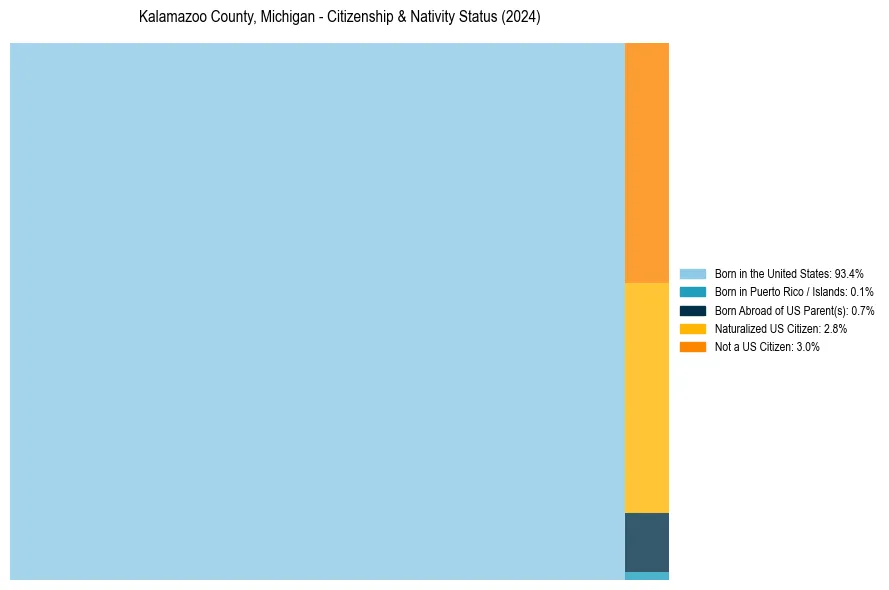
Kalamazoo County, Michigan Nativity & Citizenship Distribution
Kalamazoo County, Michigan Historical Nativity Trends (2010–2024)
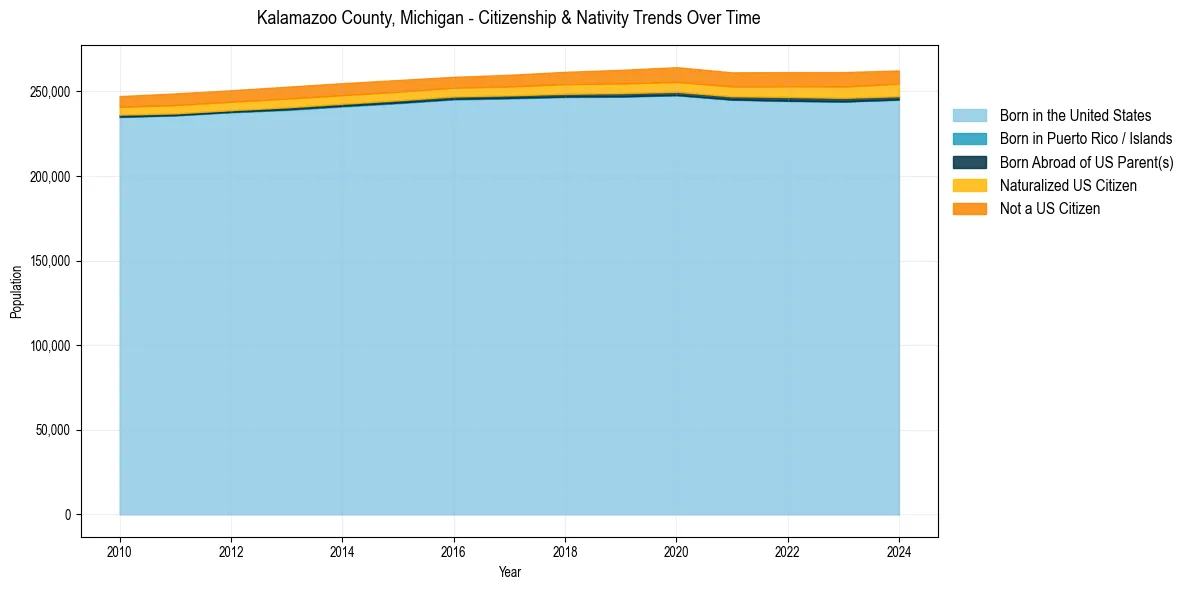
Kalamazoo County, Michigan Population & Nativity History
| Year | Total Pop | Foreign Born | Native Born |
|---|---|---|---|
| 2024 | 262,375 | 5.8% | 94.2% |
| 2023 | 261,437 | 5.8% | 94.2% |
| 2022 | 261,426 | 5.6% | 94.4% |
| 2021 | 261,280 | 5.4% | 94.6% |
| 2020 | 264,322 | 5.5% | 94.5% |
| 2019 | 262,745 | 5.2% | 94.8% |
| 2018 | 261,573 | 5.0% | 95.0% |
| 2017 | 259,830 | 4.7% | 95.3% |
| 2016 | 258,605 | 4.5% | 95.5% |
| 2015 | 256,752 | 4.7% | 95.3% |
| 2014 | 254,870 | 4.8% | 95.2% |
| 2013 | 252,763 | 4.8% | 95.2% |
| 2012 | 250,704 | 4.7% | 95.3% |
| 2011 | 248,810 | 4.7% | 95.3% |
| 2010 | 247,246 | 4.4% | 95.6% |
Nativity & Citizenship FAQs for Kalamazoo County, Michigan
Approximately 5.8% of residents in Kalamazoo County, Michigan were born outside the United States.
The vast majority of residents, roughly 97.0%, are U.S. citizens (including both native-born and naturalized citizens).