Ingham County, Michigan Nativity & Citizenship Status (2024)
Place of birth and citizenship status analysis for Ingham County, Michigan
Ingham County, Michigan Nativity & Citizenship Indicators (2024)
Native Born
90.6%
Foreign Born
9.4%
Naturalized
4.2%
US Citizens
94.8%
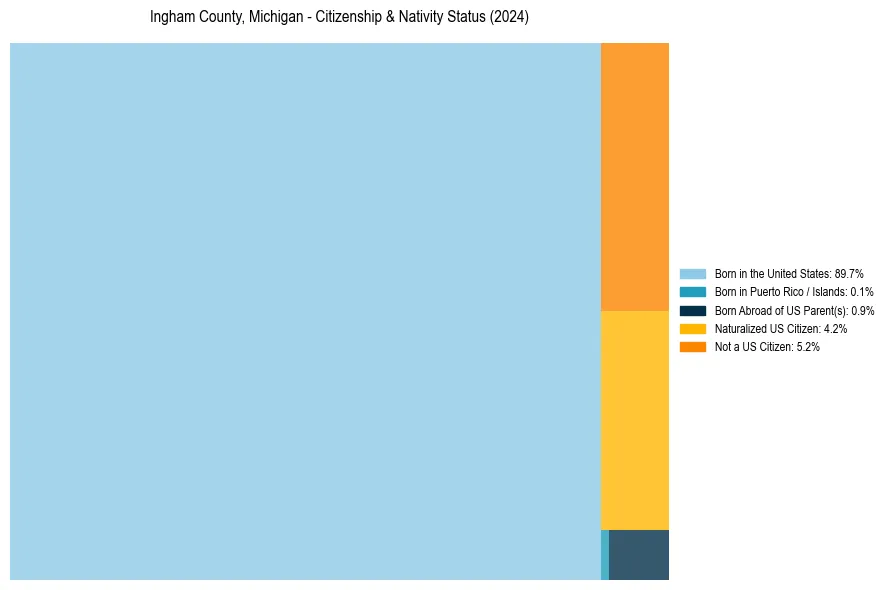
Ingham County, Michigan Nativity & Citizenship Distribution
Ingham County, Michigan Historical Nativity Trends (2010–2024)
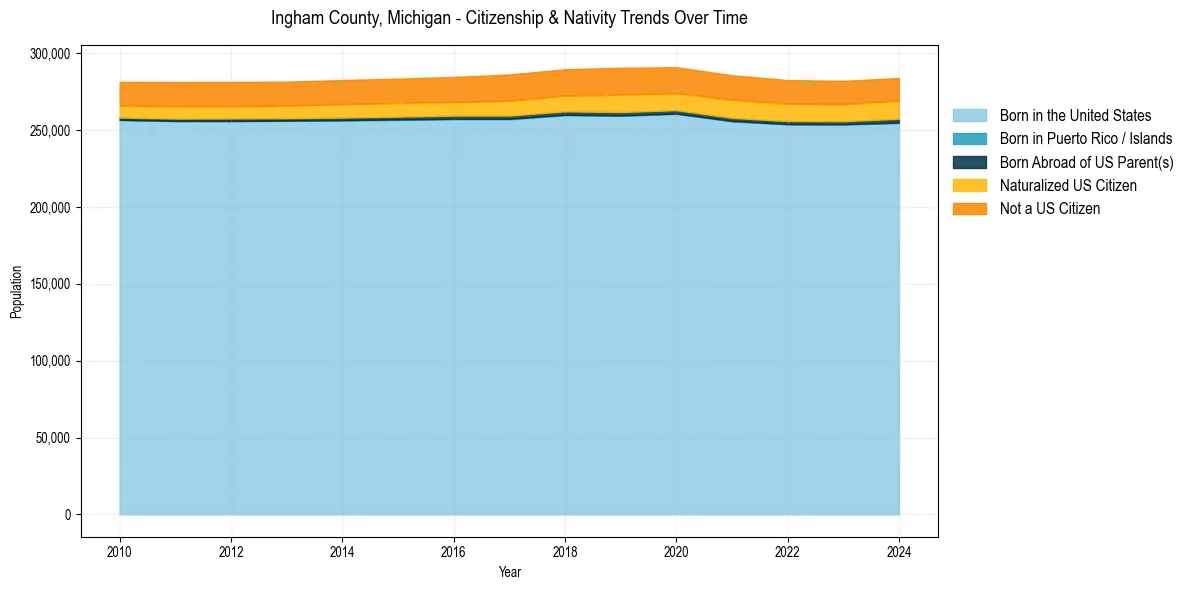
Ingham County, Michigan Population & Nativity History
| Year | Total Pop | Foreign Born | Native Born |
|---|---|---|---|
| 2024 | 283,913 | 9.4% | 90.6% |
| 2023 | 282,015 | 9.3% | 90.7% |
| 2022 | 282,540 | 9.4% | 90.6% |
| 2021 | 285,660 | 9.7% | 90.3% |
| 2020 | 290,923 | 9.6% | 90.4% |
| 2019 | 290,587 | 9.9% | 90.1% |
| 2018 | 289,564 | 9.5% | 90.5% |
| 2017 | 286,185 | 9.4% | 90.6% |
| 2016 | 284,559 | 8.8% | 91.2% |
| 2015 | 283,491 | 8.7% | 91.3% |
| 2014 | 282,562 | 8.6% | 91.4% |
| 2013 | 281,531 | 8.5% | 91.5% |
| 2012 | 281,323 | 8.4% | 91.6% |
| 2011 | 281,257 | 8.5% | 91.5% |
| 2010 | 281,365 | 8.2% | 91.8% |
Nativity & Citizenship FAQs for Ingham County, Michigan
Approximately 9.4% of residents in Ingham County, Michigan were born outside the United States.
The vast majority of residents, roughly 94.8%, are U.S. citizens (including both native-born and naturalized citizens).