Hillsdale County, Michigan Nativity & Citizenship Status (2024)
Place of birth and citizenship status analysis for Hillsdale County, Michigan
Hillsdale County, Michigan Nativity & Citizenship Indicators (2024)
Native Born
98.5%
Foreign Born
1.5%
Naturalized
0.8%
US Citizens
99.4%
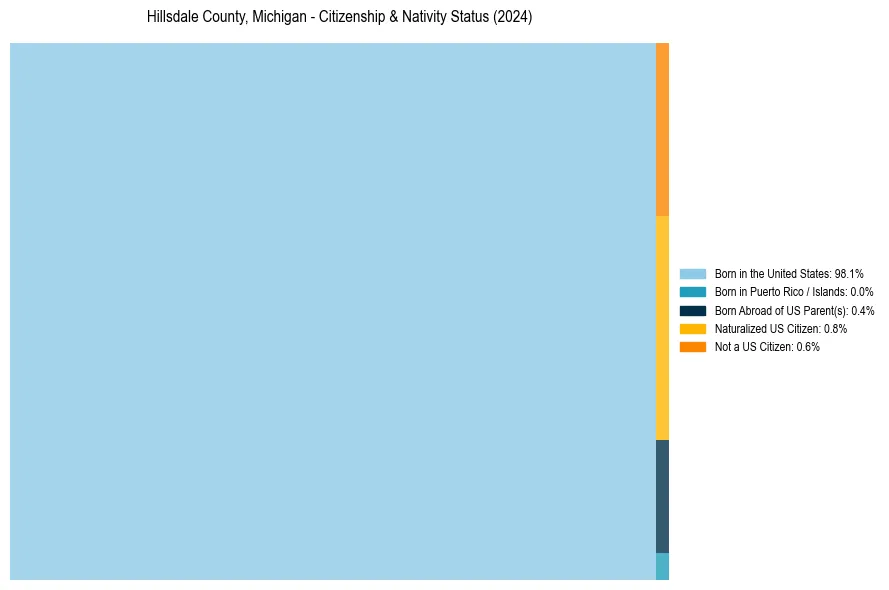
Hillsdale County, Michigan Nativity & Citizenship Distribution
Hillsdale County, Michigan Historical Nativity Trends (2010–2024)
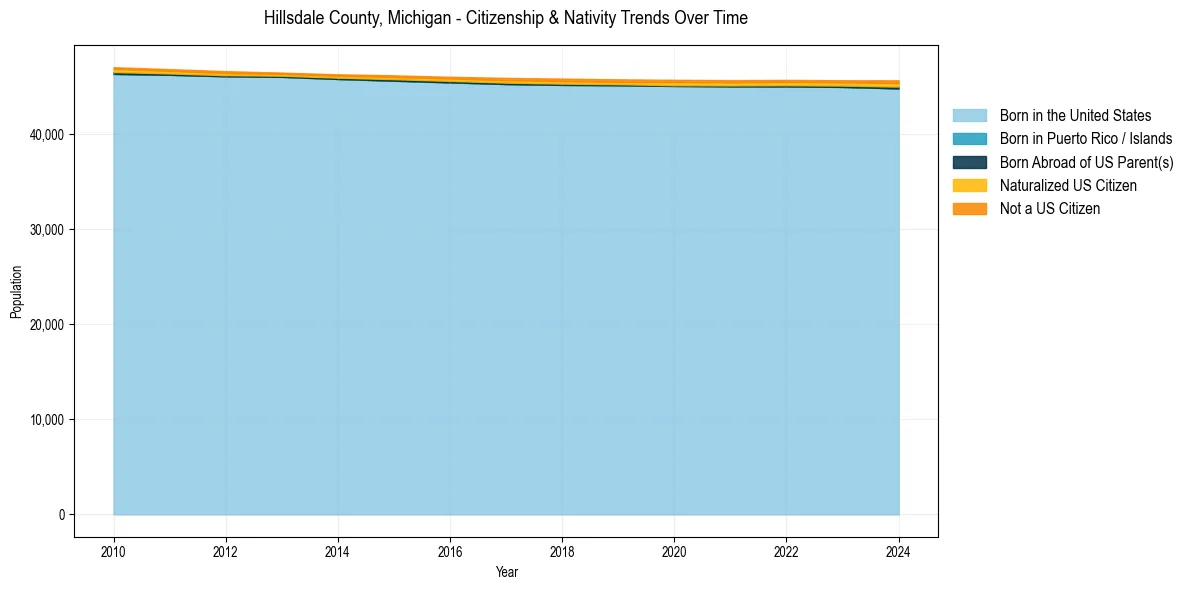
Hillsdale County, Michigan Population & Nativity History
| Year | Total Pop | Foreign Born | Native Born |
|---|---|---|---|
| 2024 | 45,654 | 1.5% | 98.5% |
| 2023 | 45,658 | 1.2% | 98.8% |
| 2022 | 45,698 | 1.2% | 98.8% |
| 2021 | 45,673 | 1.2% | 98.8% |
| 2020 | 45,707 | 1.3% | 98.7% |
| 2019 | 45,757 | 1.1% | 98.9% |
| 2018 | 45,830 | 1.1% | 98.9% |
| 2017 | 45,909 | 1.1% | 98.9% |
| 2016 | 46,024 | 0.9% | 99.1% |
| 2015 | 46,178 | 0.9% | 99.1% |
| 2014 | 46,282 | 0.8% | 99.2% |
| 2013 | 46,463 | 0.7% | 99.3% |
| 2012 | 46,617 | 0.9% | 99.1% |
| 2011 | 46,832 | 1.0% | 99.0% |
| 2010 | 47,033 | 1.1% | 98.9% |
Nativity & Citizenship FAQs for Hillsdale County, Michigan
Approximately 1.5% of residents in Hillsdale County, Michigan were born outside the United States.
The vast majority of residents, roughly 99.4%, are U.S. citizens (including both native-born and naturalized citizens).