Genesee County, Michigan Nativity & Citizenship Status (2024)
Place of birth and citizenship status analysis for Genesee County, Michigan
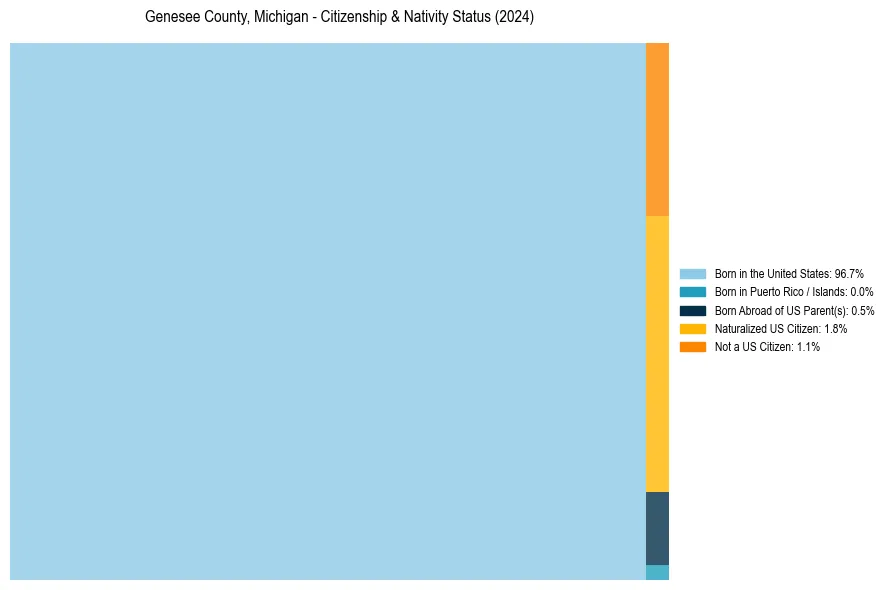
Genesee County, Michigan Nativity & Citizenship Indicators (2024)
Native Born
97.1%
Foreign Born
2.9%
Naturalized
1.8%
US Citizens
98.9%
Genesee County, Michigan Nativity & Citizenship Distribution
Genesee County, Michigan Historical Nativity Trends (2010–2024)
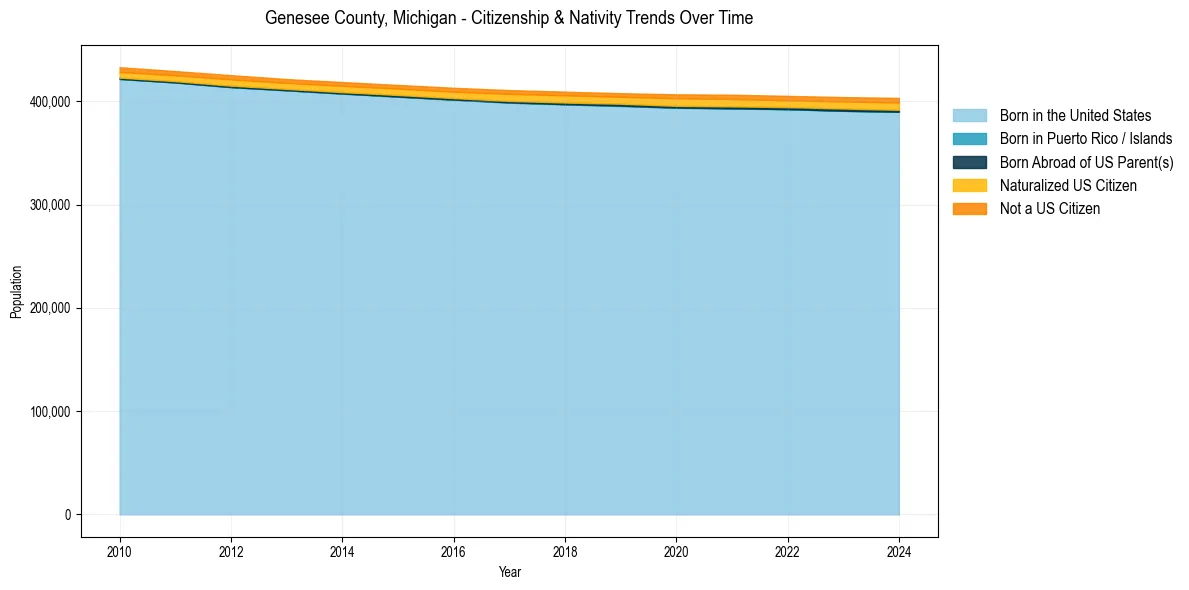
Genesee County, Michigan Population & Nativity History
| Year | Total Pop | Foreign Born | Native Born |
|---|---|---|---|
| 2024 | 403,305 | 2.9% | 97.1% |
| 2023 | 404,087 | 2.7% | 97.3% |
| 2022 | 405,280 | 2.7% | 97.3% |
| 2021 | 406,400 | 2.8% | 97.2% |
| 2020 | 406,770 | 2.7% | 97.3% |
| 2019 | 407,875 | 2.5% | 97.5% |
| 2018 | 409,361 | 2.6% | 97.4% |
| 2017 | 410,881 | 2.6% | 97.4% |
| 2016 | 413,090 | 2.4% | 97.6% |
| 2015 | 415,874 | 2.3% | 97.7% |
| 2014 | 418,654 | 2.3% | 97.7% |
| 2013 | 421,575 | 2.3% | 97.7% |
| 2012 | 425,337 | 2.4% | 97.6% |
| 2011 | 429,272 | 2.3% | 97.7% |
| 2010 | 433,054 | 2.3% | 97.7% |
Nativity & Citizenship FAQs for Genesee County, Michigan
Approximately 2.9% of residents in Genesee County, Michigan were born outside the United States.
The vast majority of residents, roughly 98.9%, are U.S. citizens (including both native-born and naturalized citizens).