Allegan County, Michigan Nativity & Citizenship Status (2024)
Place of birth and citizenship status analysis for Allegan County, Michigan
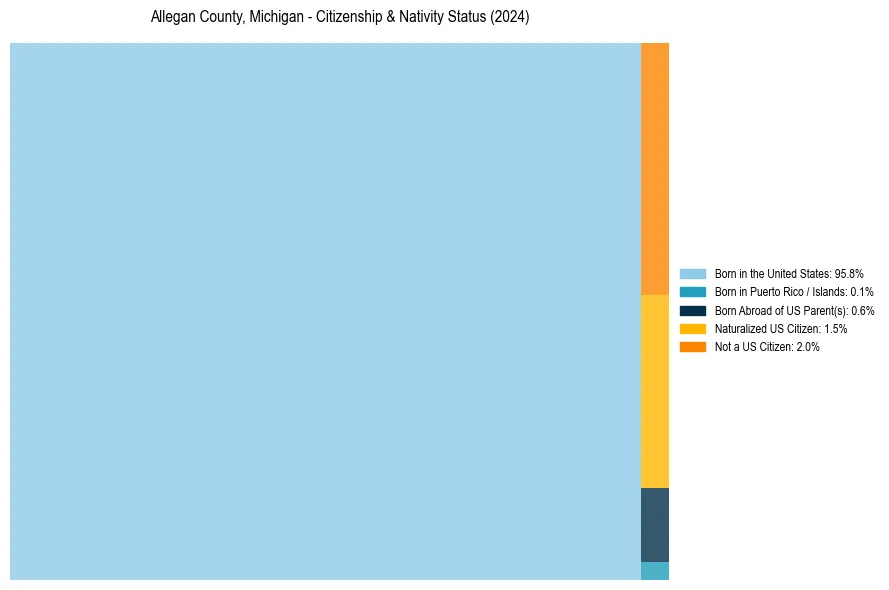
Allegan County, Michigan Nativity & Citizenship Indicators (2024)
Native Born
96.5%
Foreign Born
3.5%
Naturalized
1.5%
US Citizens
98.0%
Allegan County, Michigan Nativity & Citizenship Distribution
Allegan County, Michigan Historical Nativity Trends (2010–2024)
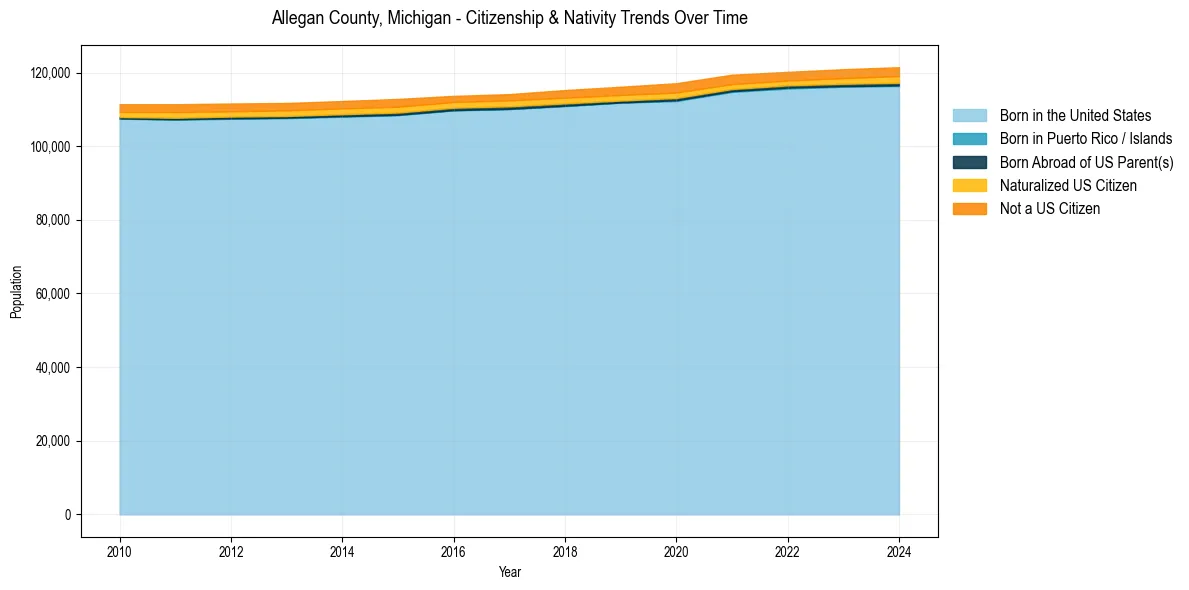
Allegan County, Michigan Population & Nativity History
| Year | Total Pop | Foreign Born | Native Born |
|---|---|---|---|
| 2024 | 121,456 | 3.5% | 96.5% |
| 2023 | 120,913 | 3.3% | 96.7% |
| 2022 | 120,189 | 3.0% | 97.0% |
| 2021 | 119,418 | 3.3% | 96.7% |
| 2020 | 117,104 | 3.4% | 96.6% |
| 2019 | 116,143 | 3.2% | 96.8% |
| 2018 | 115,250 | 3.1% | 96.9% |
| 2017 | 114,145 | 2.9% | 97.1% |
| 2016 | 113,666 | 2.8% | 97.2% |
| 2015 | 112,837 | 3.3% | 96.7% |
| 2014 | 112,266 | 3.2% | 96.8% |
| 2013 | 111,742 | 3.2% | 96.8% |
| 2012 | 111,589 | 3.2% | 96.8% |
| 2011 | 111,405 | 3.3% | 96.7% |
| 2010 | 111,385 | 3.1% | 96.9% |
Nativity & Citizenship FAQs for Allegan County, Michigan
Approximately 3.5% of residents in Allegan County, Michigan were born outside the United States.
The vast majority of residents, roughly 98.0%, are U.S. citizens (including both native-born and naturalized citizens).