Worcester County, Massachusetts Nativity & Citizenship Status (2024)
Place of birth and citizenship status analysis for Worcester County, Massachusetts
Worcester County, Massachusetts Nativity & Citizenship Indicators (2024)
Native Born
85.5%
Foreign Born
14.5%
Naturalized
7.7%
US Citizens
93.1%
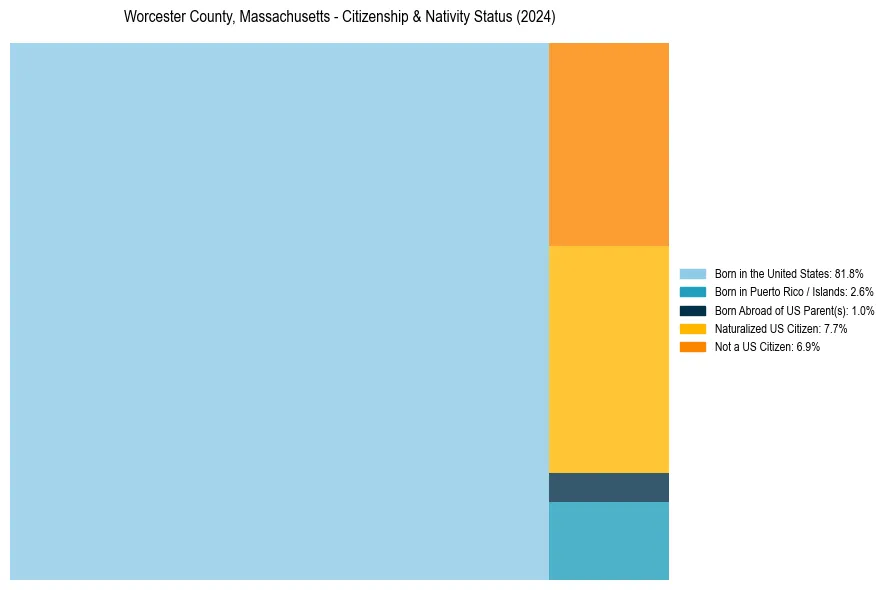
Worcester County, Massachusetts Nativity & Citizenship Distribution
Worcester County, Massachusetts Historical Nativity Trends (2010–2024)
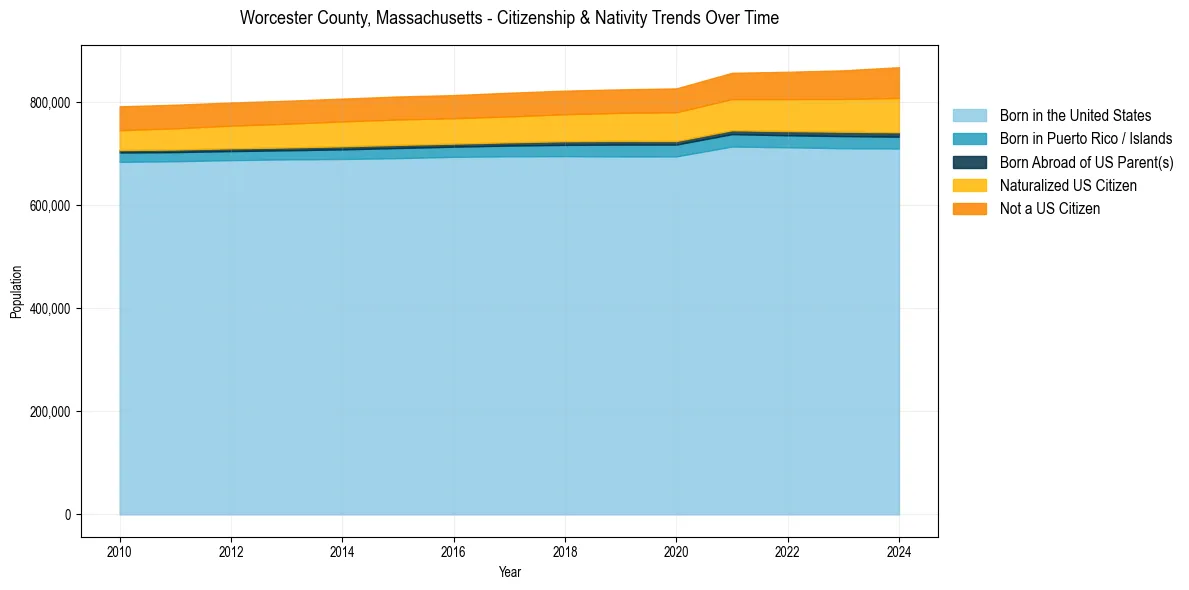
Worcester County, Massachusetts Population & Nativity History
| Year | Total Pop | Foreign Born | Native Born |
|---|---|---|---|
| 2024 | 867,788 | 14.5% | 85.5% |
| 2023 | 861,664 | 13.8% | 86.2% |
| 2022 | 858,898 | 13.4% | 86.6% |
| 2021 | 856,858 | 13.0% | 87.0% |
| 2020 | 826,655 | 12.4% | 87.6% |
| 2019 | 824,772 | 12.1% | 87.9% |
| 2018 | 822,280 | 11.9% | 88.1% |
| 2017 | 818,249 | 11.8% | 88.2% |
| 2016 | 813,589 | 11.6% | 88.4% |
| 2015 | 810,935 | 11.6% | 88.4% |
| 2014 | 806,804 | 11.5% | 88.5% |
| 2013 | 802,688 | 11.3% | 88.7% |
| 2012 | 799,277 | 11.1% | 88.9% |
| 2011 | 794,981 | 10.9% | 89.1% |
| 2010 | 791,855 | 10.7% | 89.3% |
Nativity & Citizenship FAQs for Worcester County, Massachusetts
Approximately 14.5% of residents in Worcester County, Massachusetts were born outside the United States.
The vast majority of residents, roughly 93.1%, are U.S. citizens (including both native-born and naturalized citizens).