Suffolk County, Massachusetts Nativity & Citizenship Status (2024)
Place of birth and citizenship status analysis for Suffolk County, Massachusetts
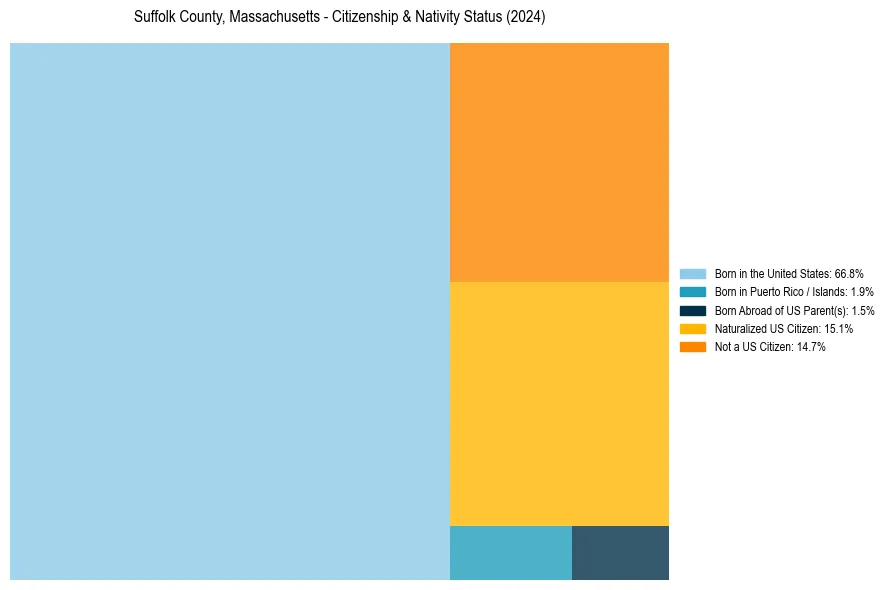
Suffolk County, Massachusetts Nativity & Citizenship Indicators (2024)
Native Born
70.2%
Foreign Born
29.8%
Naturalized
15.1%
US Citizens
85.3%
Suffolk County, Massachusetts Nativity & Citizenship Distribution
Suffolk County, Massachusetts Historical Nativity Trends (2010–2024)
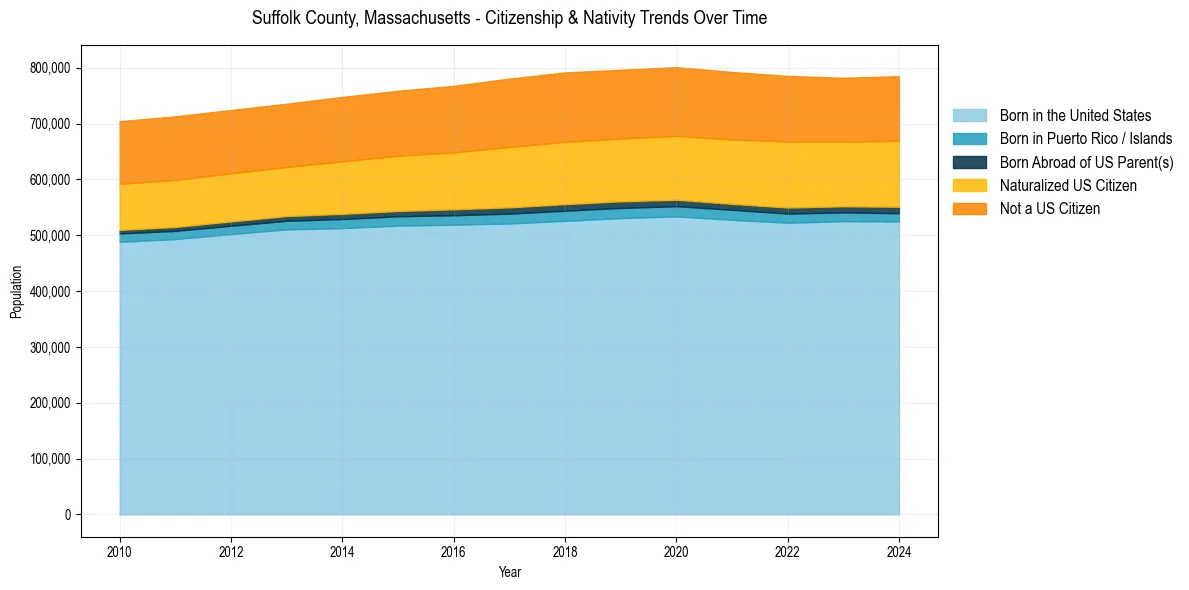
Suffolk County, Massachusetts Population & Nativity History
| Year | Total Pop | Foreign Born | Native Born |
|---|---|---|---|
| 2024 | 785,121 | 29.8% | 70.2% |
| 2023 | 782,172 | 29.4% | 70.6% |
| 2022 | 785,443 | 30.0% | 70.0% |
| 2021 | 792,647 | 29.8% | 70.2% |
| 2020 | 801,162 | 29.7% | 70.3% |
| 2019 | 796,605 | 29.6% | 70.4% |
| 2018 | 791,766 | 29.8% | 70.2% |
| 2017 | 780,685 | 29.5% | 70.5% |
| 2016 | 767,719 | 28.8% | 71.2% |
| 2015 | 758,919 | 28.4% | 71.6% |
| 2014 | 747,928 | 28.0% | 72.0% |
| 2013 | 735,701 | 27.4% | 72.6% |
| 2012 | 724,502 | 27.6% | 72.4% |
| 2011 | 713,089 | 27.8% | 72.2% |
| 2010 | 704,460 | 27.7% | 72.3% |
Nativity & Citizenship FAQs for Suffolk County, Massachusetts
Approximately 29.8% of residents in Suffolk County, Massachusetts were born outside the United States.
The vast majority of residents, roughly 85.3%, are U.S. citizens (including both native-born and naturalized citizens).