Plymouth County, Massachusetts Nativity & Citizenship Status (2024)
Place of birth and citizenship status analysis for Plymouth County, Massachusetts
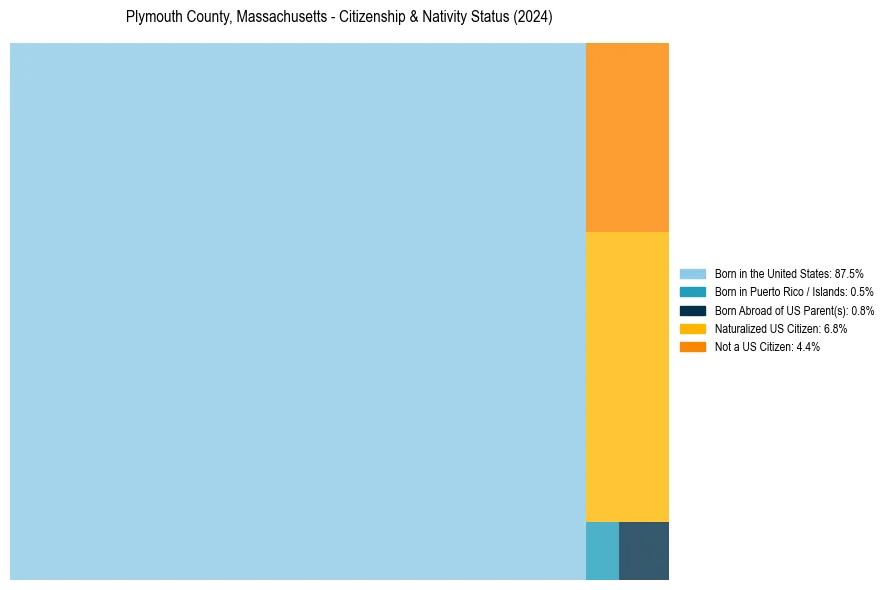
Plymouth County, Massachusetts Nativity & Citizenship Indicators (2024)
Native Born
88.8%
Foreign Born
11.2%
Naturalized
6.8%
US Citizens
95.6%
Plymouth County, Massachusetts Nativity & Citizenship Distribution
Plymouth County, Massachusetts Historical Nativity Trends (2010–2024)
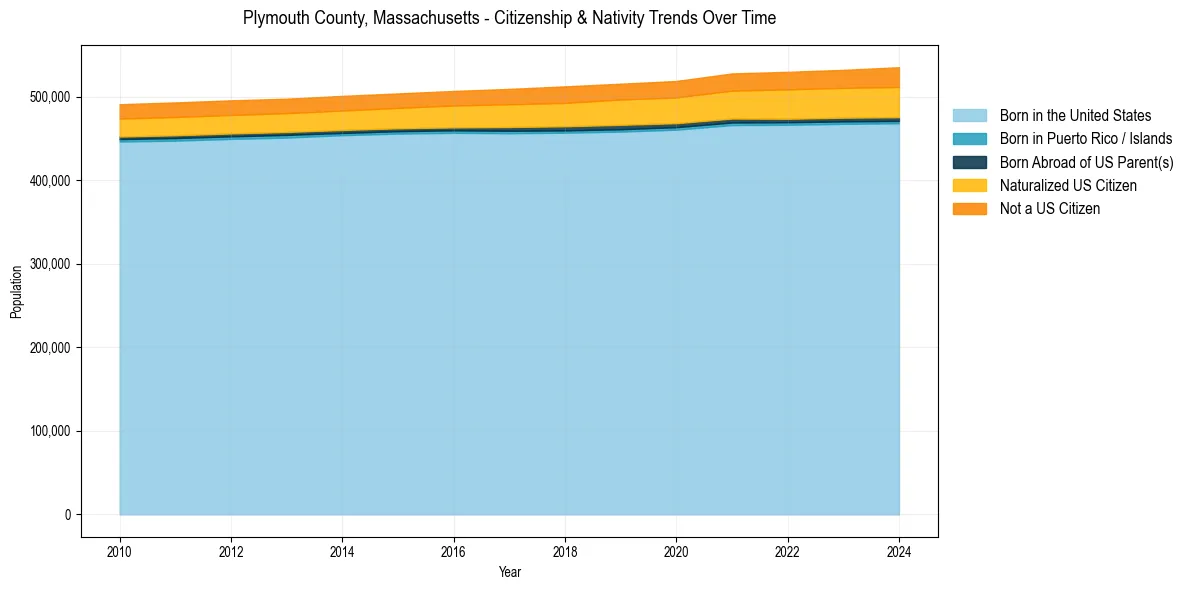
Plymouth County, Massachusetts Population & Nativity History
| Year | Total Pop | Foreign Born | Native Born |
|---|---|---|---|
| 2024 | 535,075 | 11.2% | 88.8% |
| 2023 | 531,889 | 10.8% | 89.2% |
| 2022 | 529,548 | 10.6% | 89.4% |
| 2021 | 527,602 | 10.2% | 89.8% |
| 2020 | 518,597 | 9.7% | 90.3% |
| 2019 | 515,303 | 9.5% | 90.5% |
| 2018 | 512,135 | 9.3% | 90.7% |
| 2017 | 509,114 | 9.0% | 91.0% |
| 2016 | 506,657 | 8.6% | 91.4% |
| 2015 | 503,681 | 8.3% | 91.7% |
| 2014 | 500,772 | 8.2% | 91.8% |
| 2013 | 497,386 | 8.0% | 92.0% |
| 2012 | 495,407 | 8.0% | 92.0% |
| 2011 | 492,934 | 8.0% | 92.0% |
| 2010 | 490,784 | 7.9% | 92.1% |
Nativity & Citizenship FAQs for Plymouth County, Massachusetts
Approximately 11.2% of residents in Plymouth County, Massachusetts were born outside the United States.
The vast majority of residents, roughly 95.6%, are U.S. citizens (including both native-born and naturalized citizens).