Norfolk County, Massachusetts Nativity & Citizenship Status (2024)
Place of birth and citizenship status analysis for Norfolk County, Massachusetts
Norfolk County, Massachusetts Nativity & Citizenship Indicators (2024)
Native Born
80.7%
Foreign Born
19.3%
Naturalized
11.4%
US Citizens
92.1%
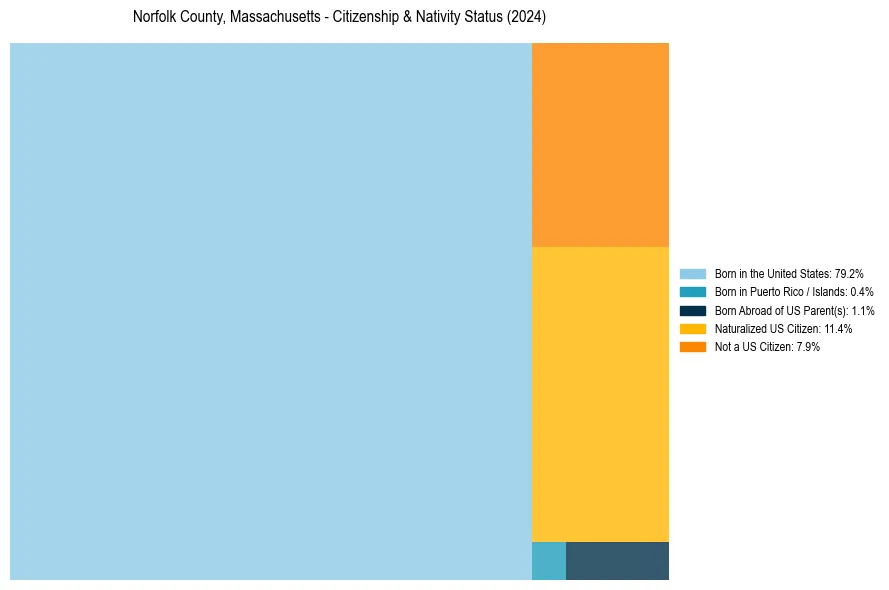
Norfolk County, Massachusetts Nativity & Citizenship Distribution
Norfolk County, Massachusetts Historical Nativity Trends (2010–2024)
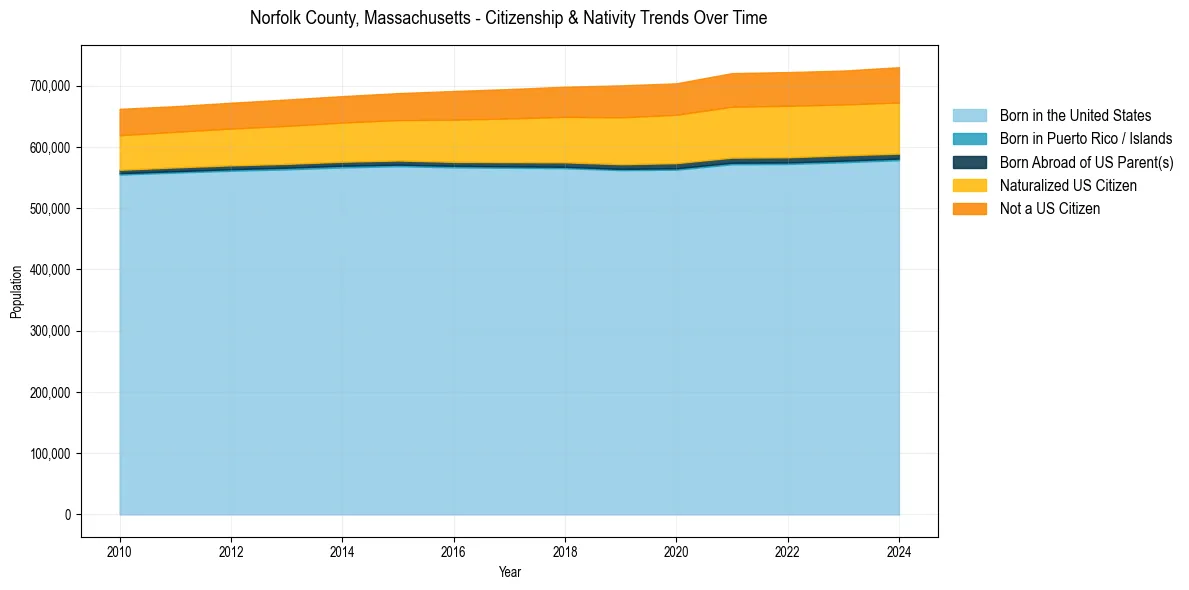
Norfolk County, Massachusetts Population & Nativity History
| Year | Total Pop | Foreign Born | Native Born |
|---|---|---|---|
| 2024 | 730,082 | 19.3% | 80.7% |
| 2023 | 724,540 | 19.1% | 80.9% |
| 2022 | 722,112 | 19.3% | 80.7% |
| 2021 | 720,403 | 19.2% | 80.8% |
| 2020 | 703,740 | 18.5% | 81.5% |
| 2019 | 700,437 | 18.4% | 81.6% |
| 2018 | 698,249 | 17.7% | 82.3% |
| 2017 | 694,389 | 17.2% | 82.8% |
| 2016 | 691,218 | 16.7% | 83.3% |
| 2015 | 687,721 | 16.0% | 84.0% |
| 2014 | 682,860 | 15.7% | 84.3% |
| 2013 | 677,296 | 15.5% | 84.5% |
| 2012 | 672,078 | 15.2% | 84.8% |
| 2011 | 666,426 | 15.0% | 85.0% |
| 2010 | 662,077 | 15.0% | 85.0% |
Nativity & Citizenship FAQs for Norfolk County, Massachusetts
Approximately 19.3% of residents in Norfolk County, Massachusetts were born outside the United States.
The vast majority of residents, roughly 92.1%, are U.S. citizens (including both native-born and naturalized citizens).