Hampshire County, Massachusetts Nativity & Citizenship Status (2024)
Place of birth and citizenship status analysis for Hampshire County, Massachusetts
Hampshire County, Massachusetts Nativity & Citizenship Indicators (2024)
Native Born
91.6%
Foreign Born
8.4%
Naturalized
4.6%
US Citizens
96.1%
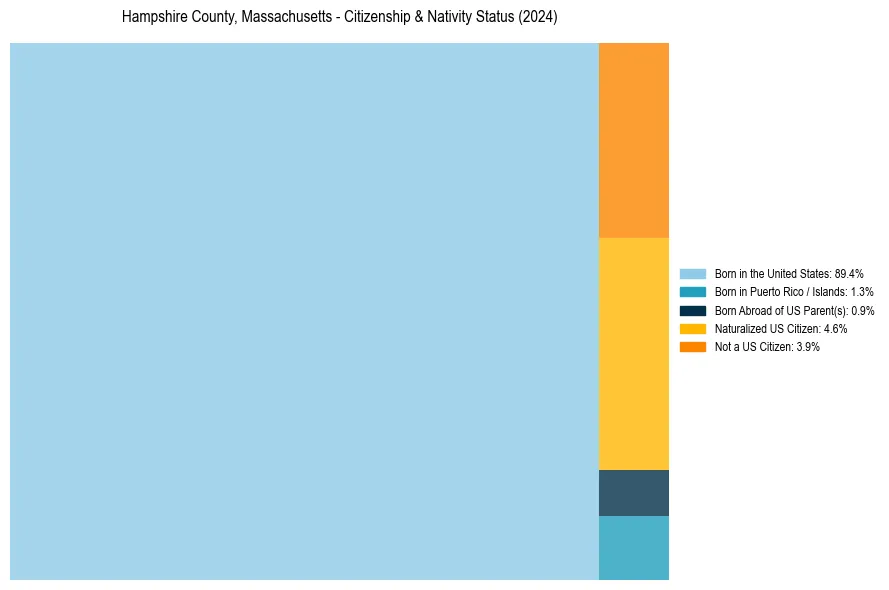
Hampshire County, Massachusetts Nativity & Citizenship Distribution
Hampshire County, Massachusetts Historical Nativity Trends (2010–2024)
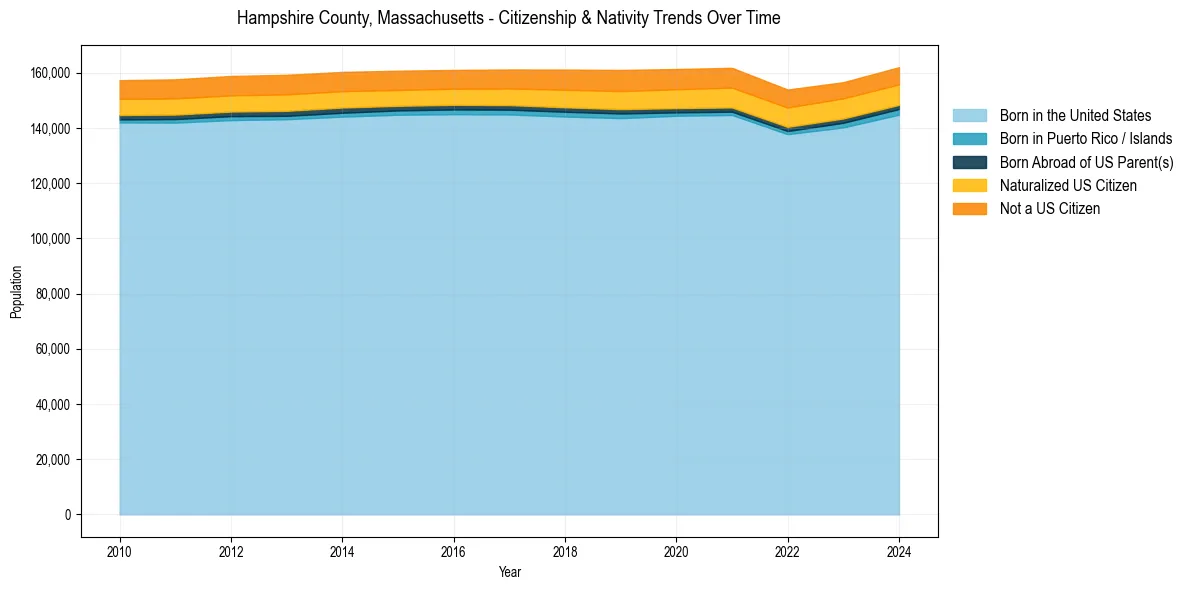
Hampshire County, Massachusetts Population & Nativity History
| Year | Total Pop | Foreign Born | Native Born |
|---|---|---|---|
| 2024 | 162,028 | 8.4% | 91.6% |
| 2023 | 156,595 | 8.4% | 91.6% |
| 2022 | 153,931 | 8.8% | 91.2% |
| 2021 | 161,810 | 8.9% | 91.1% |
| 2020 | 161,361 | 8.8% | 91.2% |
| 2019 | 161,032 | 8.8% | 91.2% |
| 2018 | 161,159 | 8.5% | 91.5% |
| 2017 | 161,197 | 8.0% | 92.0% |
| 2016 | 161,035 | 7.8% | 92.2% |
| 2015 | 160,759 | 7.9% | 92.1% |
| 2014 | 160,328 | 8.1% | 91.9% |
| 2013 | 159,267 | 8.2% | 91.8% |
| 2012 | 158,850 | 8.1% | 91.9% |
| 2011 | 157,630 | 8.1% | 91.9% |
| 2010 | 157,326 | 8.0% | 92.0% |
Nativity & Citizenship FAQs for Hampshire County, Massachusetts
Approximately 8.4% of residents in Hampshire County, Massachusetts were born outside the United States.
The vast majority of residents, roughly 96.1%, are U.S. citizens (including both native-born and naturalized citizens).