Hampden County, Massachusetts Nativity & Citizenship Status (2024)
Place of birth and citizenship status analysis for Hampden County, Massachusetts
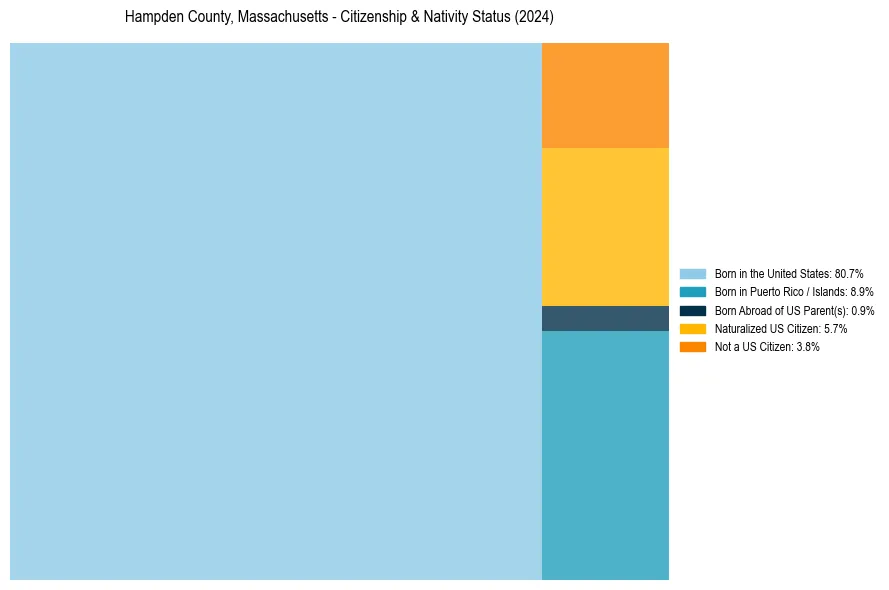
Hampden County, Massachusetts Nativity & Citizenship Indicators (2024)
Native Born
90.6%
Foreign Born
9.4%
Naturalized
5.7%
US Citizens
96.2%
Hampden County, Massachusetts Nativity & Citizenship Distribution
Hampden County, Massachusetts Historical Nativity Trends (2010–2024)
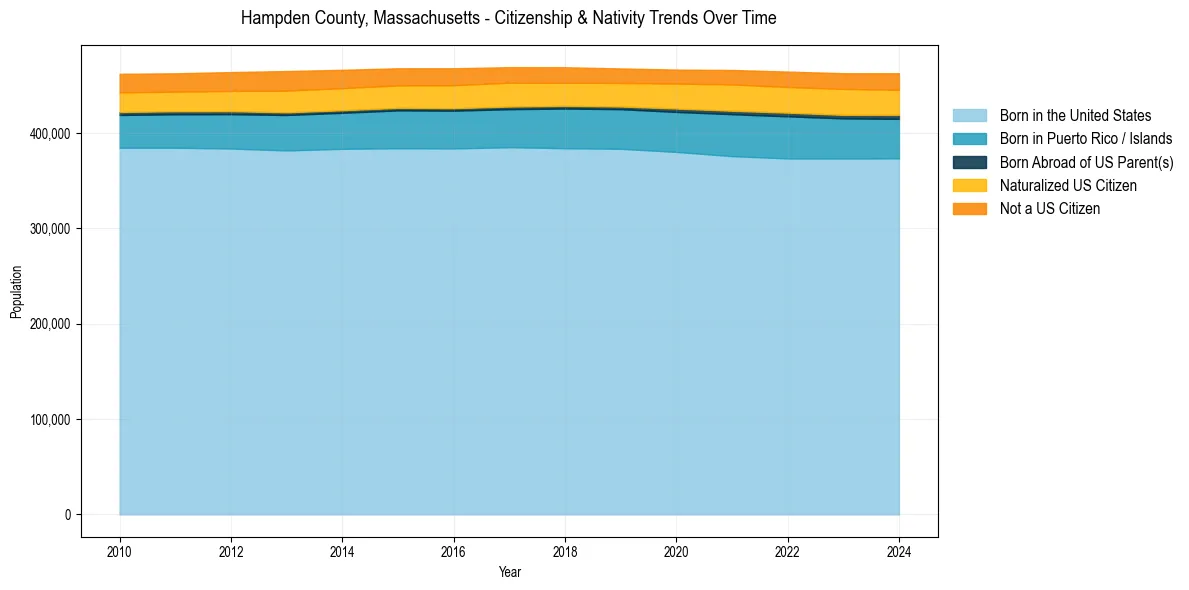
Hampden County, Massachusetts Population & Nativity History
| Year | Total Pop | Foreign Born | Native Born |
|---|---|---|---|
| 2024 | 462,815 | 9.4% | 90.6% |
| 2023 | 462,853 | 9.4% | 90.6% |
| 2022 | 464,575 | 9.3% | 90.7% |
| 2021 | 466,265 | 9.2% | 90.8% |
| 2020 | 466,647 | 8.8% | 91.2% |
| 2019 | 467,871 | 8.5% | 91.5% |
| 2018 | 469,116 | 8.6% | 91.4% |
| 2017 | 469,188 | 8.8% | 91.2% |
| 2016 | 468,072 | 9.0% | 91.0% |
| 2015 | 468,041 | 8.9% | 91.1% |
| 2014 | 466,447 | 9.1% | 90.9% |
| 2013 | 465,144 | 9.3% | 90.7% |
| 2012 | 464,072 | 8.9% | 91.1% |
| 2011 | 462,752 | 8.6% | 91.4% |
| 2010 | 462,270 | 8.7% | 91.3% |
Nativity & Citizenship FAQs for Hampden County, Massachusetts
Approximately 9.4% of residents in Hampden County, Massachusetts were born outside the United States.
The vast majority of residents, roughly 96.2%, are U.S. citizens (including both native-born and naturalized citizens).