Essex County, Massachusetts Nativity & Citizenship Status (2024)
Place of birth and citizenship status analysis for Essex County, Massachusetts
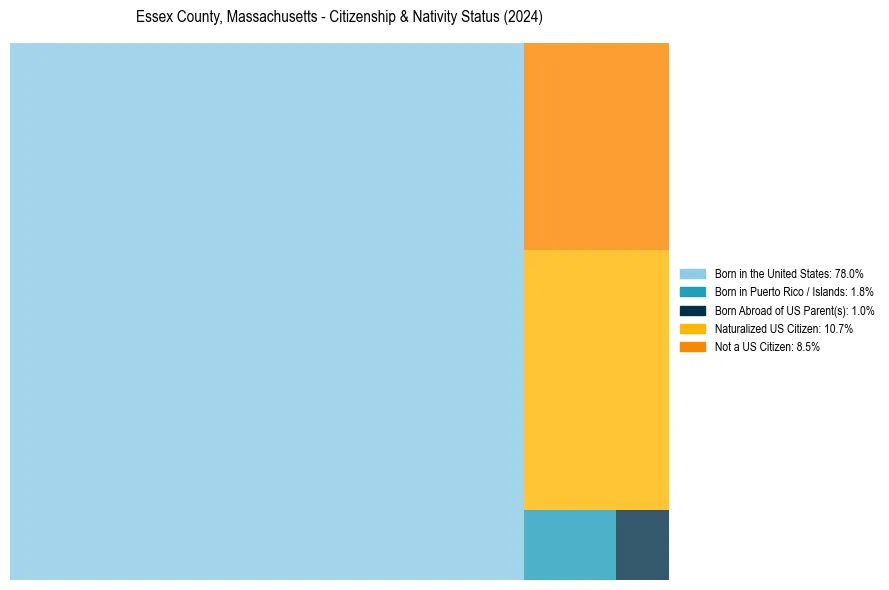
Essex County, Massachusetts Nativity & Citizenship Indicators (2024)
Native Born
80.9%
Foreign Born
19.1%
Naturalized
10.7%
US Citizens
91.5%
Essex County, Massachusetts Nativity & Citizenship Distribution
Essex County, Massachusetts Historical Nativity Trends (2010–2024)
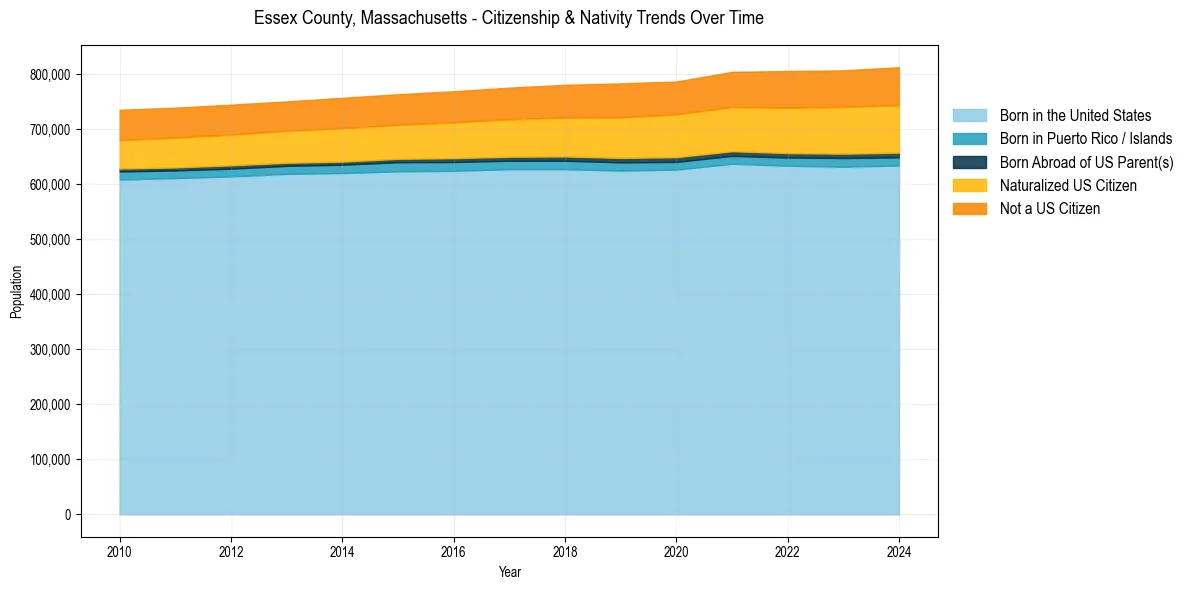
Essex County, Massachusetts Population & Nativity History
| Year | Total Pop | Foreign Born | Native Born |
|---|---|---|---|
| 2024 | 813,054 | 19.1% | 80.9% |
| 2023 | 807,258 | 18.8% | 81.2% |
| 2022 | 806,103 | 18.5% | 81.5% |
| 2021 | 804,598 | 17.9% | 82.1% |
| 2020 | 787,038 | 17.5% | 82.5% |
| 2019 | 783,676 | 17.3% | 82.7% |
| 2018 | 781,024 | 16.7% | 83.3% |
| 2017 | 775,860 | 16.2% | 83.8% |
| 2016 | 769,362 | 15.8% | 84.2% |
| 2015 | 763,849 | 15.4% | 84.6% |
| 2014 | 757,395 | 15.3% | 84.7% |
| 2013 | 750,808 | 14.9% | 85.1% |
| 2012 | 744,961 | 14.8% | 85.2% |
| 2011 | 739,505 | 14.7% | 85.3% |
| 2010 | 735,642 | 14.5% | 85.5% |
Nativity & Citizenship FAQs for Essex County, Massachusetts
Approximately 19.1% of residents in Essex County, Massachusetts were born outside the United States.
The vast majority of residents, roughly 91.5%, are U.S. citizens (including both native-born and naturalized citizens).