Barnstable County, Massachusetts Nativity & Citizenship Status (2024)
Place of birth and citizenship status analysis for Barnstable County, Massachusetts
Barnstable County, Massachusetts Nativity & Citizenship Indicators (2024)
Native Born
90.1%
Foreign Born
9.9%
Naturalized
5.4%
US Citizens
95.5%
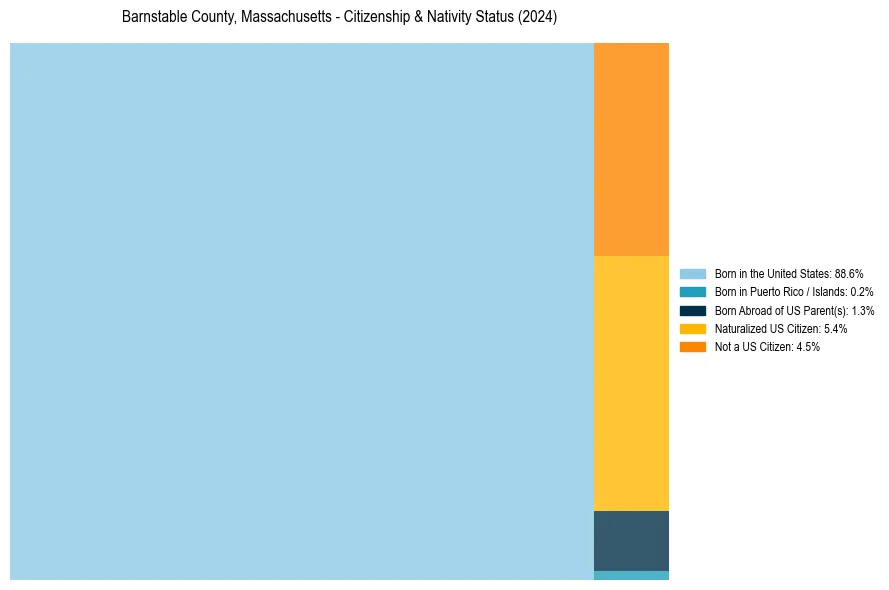
Barnstable County, Massachusetts Nativity & Citizenship Distribution
Barnstable County, Massachusetts Historical Nativity Trends (2010–2024)
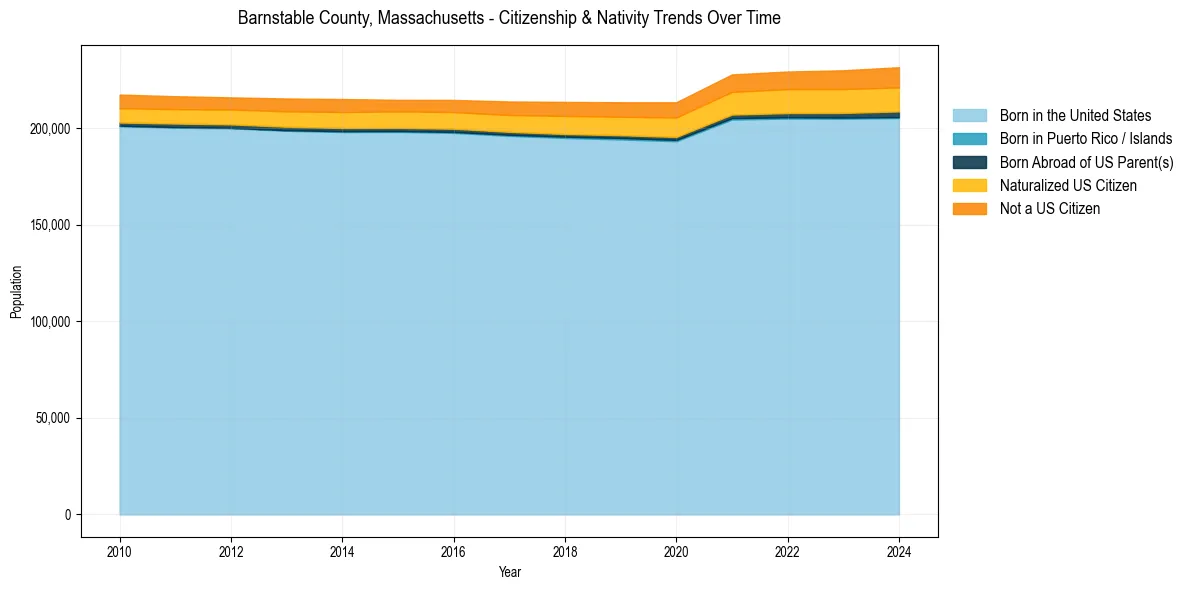
Barnstable County, Massachusetts Population & Nativity History
| Year | Total Pop | Foreign Born | Native Born |
|---|---|---|---|
| 2024 | 231,668 | 9.9% | 90.1% |
| 2023 | 230,073 | 9.6% | 90.4% |
| 2022 | 229,436 | 9.4% | 90.6% |
| 2021 | 227,942 | 9.1% | 90.9% |
| 2020 | 213,505 | 8.4% | 91.6% |
| 2019 | 213,496 | 8.0% | 92.0% |
| 2018 | 213,690 | 7.8% | 92.2% |
| 2017 | 213,900 | 7.4% | 92.6% |
| 2016 | 214,703 | 6.9% | 93.1% |
| 2015 | 214,766 | 6.8% | 93.2% |
| 2014 | 215,167 | 7.0% | 93.0% |
| 2013 | 215,449 | 6.8% | 93.2% |
| 2012 | 216,021 | 6.5% | 93.5% |
| 2011 | 216,639 | 6.5% | 93.5% |
| 2010 | 217,483 | 6.7% | 93.3% |
Nativity & Citizenship FAQs for Barnstable County, Massachusetts
Approximately 9.9% of residents in Barnstable County, Massachusetts were born outside the United States.
The vast majority of residents, roughly 95.5%, are U.S. citizens (including both native-born and naturalized citizens).