Prince George's County, Maryland Nativity & Citizenship Status (2024)
Place of birth and citizenship status analysis for Prince George's County, Maryland
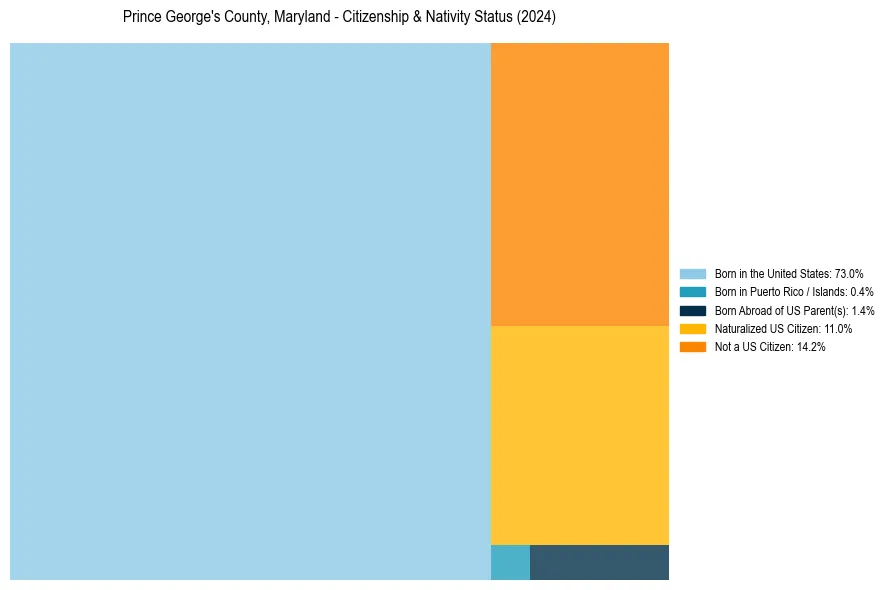
Prince George's County, Maryland Nativity & Citizenship Indicators (2024)
Native Born
74.7%
Foreign Born
25.3%
Naturalized
11.0%
US Citizens
85.8%
Prince George's County, Maryland Nativity & Citizenship Distribution
Prince George's County, Maryland Historical Nativity Trends (2010–2024)
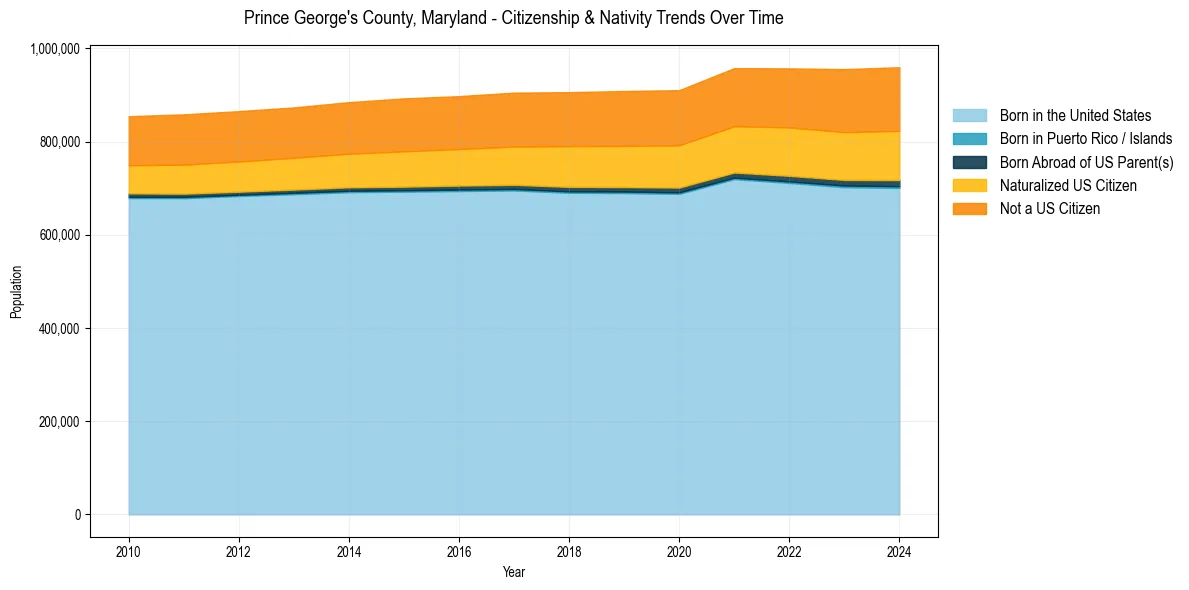
Prince George's County, Maryland Population & Nativity History
| Year | Total Pop | Foreign Born | Native Born |
|---|---|---|---|
| 2024 | 959,754 | 25.3% | 74.7% |
| 2023 | 955,584 | 24.9% | 75.1% |
| 2022 | 957,189 | 24.1% | 75.9% |
| 2021 | 957,767 | 23.4% | 76.6% |
| 2020 | 910,551 | 23.0% | 77.0% |
| 2019 | 908,670 | 22.7% | 77.3% |
| 2018 | 906,202 | 22.4% | 77.6% |
| 2017 | 905,161 | 21.9% | 78.1% |
| 2016 | 897,693 | 21.4% | 78.6% |
| 2015 | 892,816 | 21.2% | 78.8% |
| 2014 | 884,764 | 20.7% | 79.3% |
| 2013 | 873,481 | 20.2% | 79.8% |
| 2012 | 865,443 | 20.0% | 80.0% |
| 2011 | 858,539 | 19.8% | 80.2% |
| 2010 | 854,722 | 19.4% | 80.6% |
Nativity & Citizenship FAQs for Prince George's County, Maryland
Approximately 25.3% of residents in Prince George's County, Maryland were born outside the United States.
The vast majority of residents, roughly 85.8%, are U.S. citizens (including both native-born and naturalized citizens).