Maryland Nativity & Citizenship Status (2024)
Place of birth and citizenship status analysis for Maryland
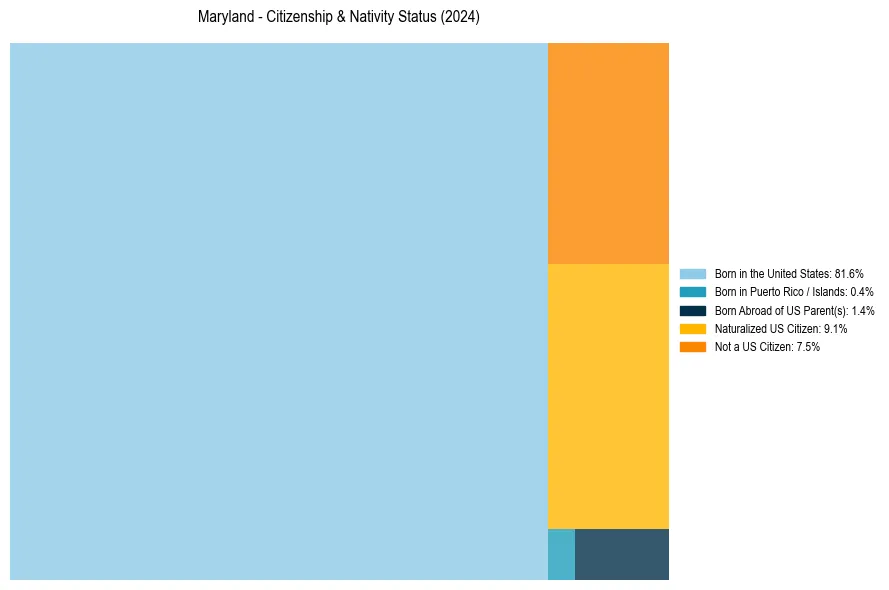
Maryland Nativity & Citizenship Indicators (2024)
Native Born
83.4%
Foreign Born
16.6%
Naturalized
9.1%
US Citizens
92.5%
Maryland Nativity & Citizenship Distribution
Maryland Historical Nativity Trends (2010–2024)
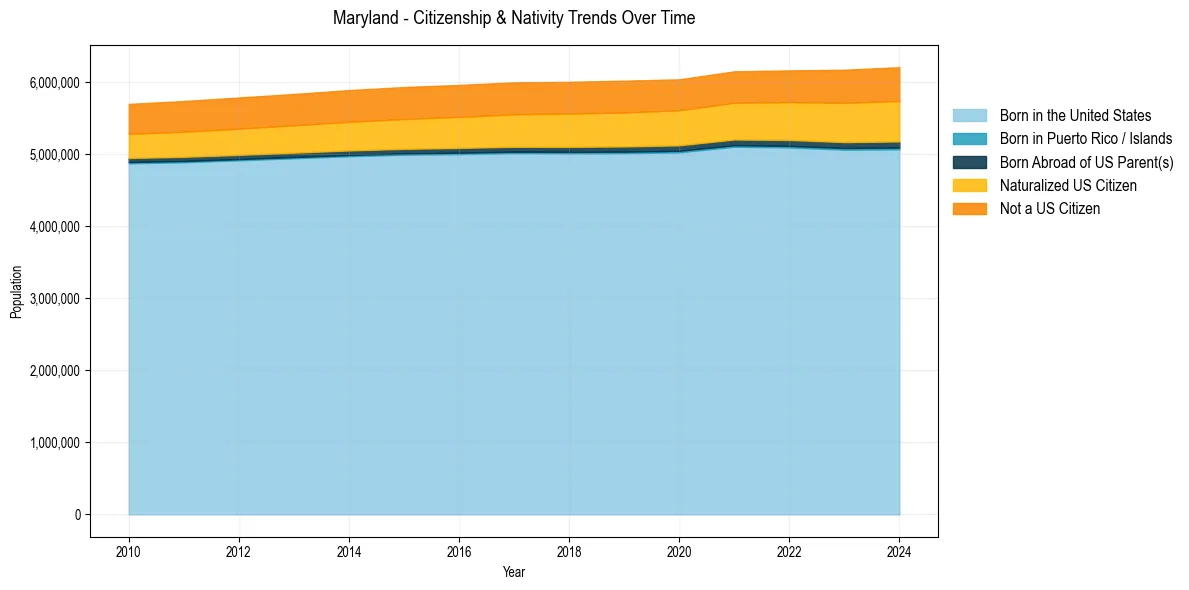
Maryland Population & Nativity History
| Year | Total Pop | Foreign Born | Native Born |
|---|---|---|---|
| 2024 | 6,206,011 | 16.6% | 83.4% |
| 2023 | 6,170,738 | 16.3% | 83.7% |
| 2022 | 6,161,707 | 15.7% | 84.3% |
| 2021 | 6,148,545 | 15.4% | 84.6% |
| 2020 | 6,037,624 | 15.2% | 84.8% |
| 2019 | 6,018,848 | 15.2% | 84.8% |
| 2018 | 6,003,435 | 15.1% | 84.9% |
| 2017 | 5,996,079 | 14.9% | 85.1% |
| 2016 | 5,959,902 | 14.7% | 85.3% |
| 2015 | 5,930,538 | 14.5% | 85.5% |
| 2014 | 5,887,776 | 14.2% | 85.8% |
| 2013 | 5,834,299 | 14.0% | 86.0% |
| 2012 | 5,785,496 | 13.8% | 86.2% |
| 2011 | 5,736,545 | 13.5% | 86.5% |
| 2010 | 5,696,423 | 13.2% | 86.8% |
Nativity & Citizenship FAQs for Maryland
Approximately 16.6% of residents in Maryland were born outside the United States.
The vast majority of residents, roughly 92.5%, are U.S. citizens (including both native-born and naturalized citizens).